
Building Energy Performance Analytics Overview
Summary
The Building Energy Performance Analytics (BEPA) module is Envizi's advanced meter monitoring and reporting tool. It is part of Envizi's Energy Management solution. BEPA analyzes your meter data to help find inefficiencies in your operations and drive higher performing buildings.
Benefits
BEPA provides organizations, and operations managers the following outcomes:
Gain insight into inefficient energy consumption
Increase Facility Manager's (FM) visibility and response time to known issues
Improve maintenance programming and performance based on information driven decision making
Navigation
Via Quick Link
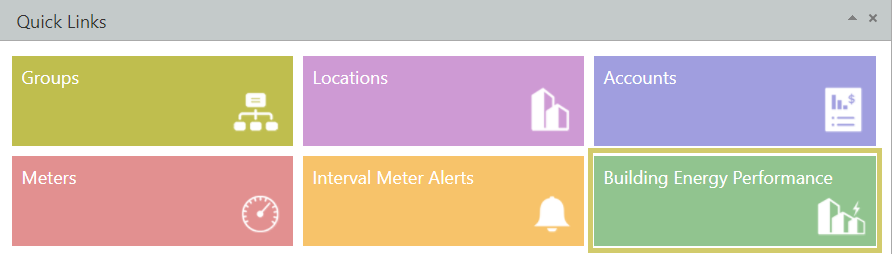
The quick link Building Energy Performance is the primary means for you to access and administer BEPA. BEPA allows you to manage and update meter attributes (e.g the expected profile). It is also the main interface for you to configure alerts, manage issues and access the organizational level analysis dashboards.
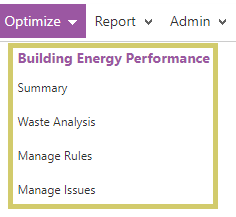
Via the Optimize Menu
You can also access BEPA via the Optimize menu by selecting options under Building Energy Performance You can access pages within BEPA including the Summary page, Waste Analysis dashboards, Manage Rules page and Manage Issues page.
Cost Savings Potential
One of the features of BEPA is to calculate a financial impact of an issue. When a consumption rule (absolute and variance) is triggered, Envizi calculates the financial impact. The financial impact is calculated by first determining the energy impact (Unit Variance) of the event, it then applies a flat rate per unit (i.e $/kWh). The unit rate can be set based on the following hierarchy:
Nominal Rate set at a location level* (using the Target functionality)
Associate attribute (unit price)
If none of the above is set, Envizi will apply a default value to $1/kWh
The financial impact of each consumption alert (absolute and variance) is calculated and stored in Envizi, to provide a means for you to rank and prioritize issues. However the financial cost reported in the summary page and the Energy Waste Cost dashboard are ONLY looking at the consumption variance alerts (i.e the difference between actual vs expected consumption).
*Nominal rates are required to be configured if multiple data types are being managed.
Root Cause and Related Item Tags
You can configure the list of root causes and related items to your specific requirements. Below is a guide as to what information is appropriate for each list; however, it is recommended that you consult with Envizi to determine the most relevant list of root causes and building services / related items for your organization as the lists can be customized.
Root Causes:
Manual override of building schedule
Set point incorrectly configured
Contractor fault
Early call for air con
Unscheduled late shutdown
Mechanical fault
Sensor fault
Pneumatic fault
Out of hours use of space
Cleaners
Building Services / Related Items
HVAC - AHU
HVAC - Chiller
HVAC - Boiler
Car Park Lighting
General Plug load
General Lighting
Safety Lighting
Summary Page
When you click on the BEPA quick link, or the summary link via the Optimize menu, you will be taken to the BEPA Summary page by default. The BEPA Summary page is designed to provide you with an overview of recent activity relating to energy waste activities and the quantification of energy waste in dollar terms over the last 30 days. The BEPA Summary page also has a number of links which you can use to access more details. The BEPA Summary page only shows you locations that have an expected profile configured for at least one of the meters in that location. If an expected profile is not assigned to any meters, then that location will not show up in the table. This means that you should complete the configuration of meters and expected profiles before you can use BEPA. If there are locations that you expect should be showing up in BEPA, please contact Envizi Support to have these locations enabled.
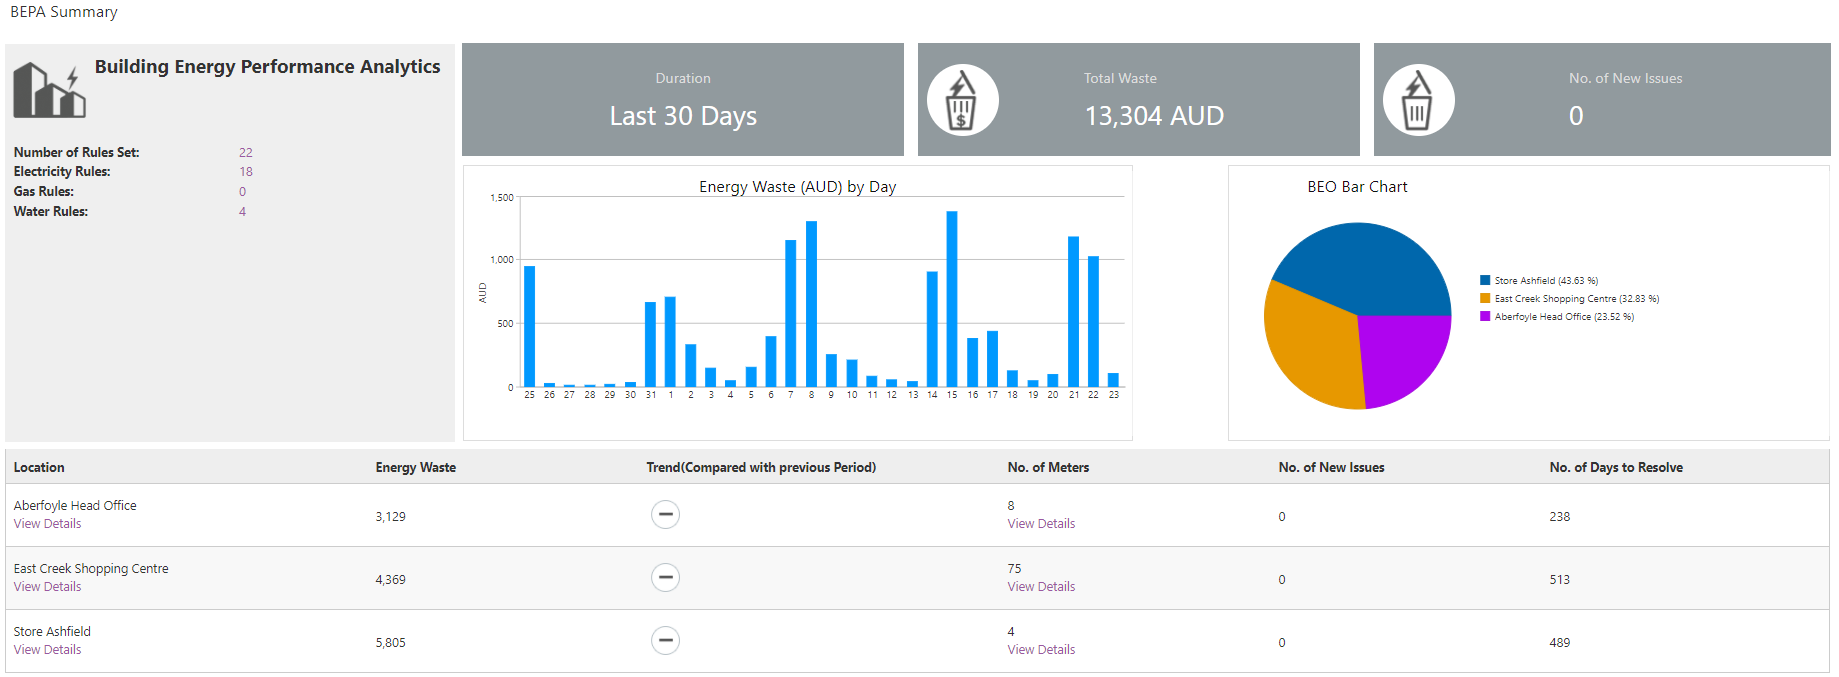
The Location View Details link will take you to the location Energy Waste - Cost"dashboard. It will also take you out of the BEPA and into the location summary level. You can click the back arrow to return to the BEPA Summary page.
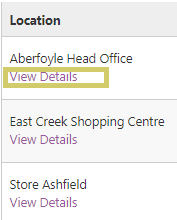
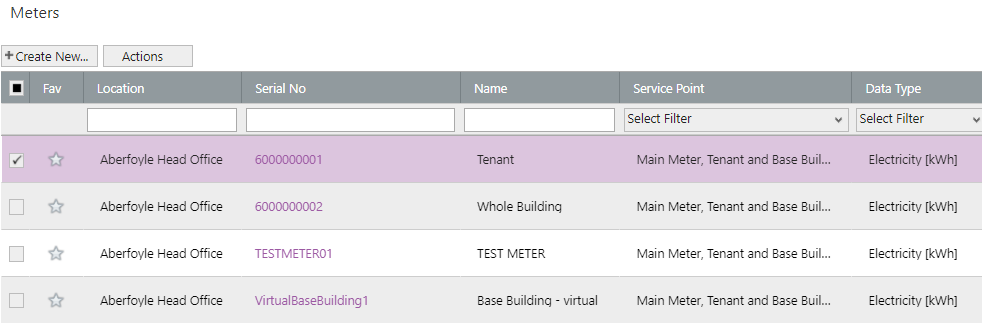
The No. of Meters View Details link will take you to the meter page.
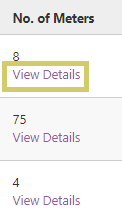
The meter page will show a list of all the meters at a given location. From here you can use a right click function or select the Actions button to update attribute settings of the meter (e.g. change an expected profile).
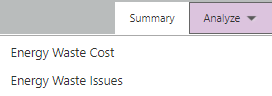
Analyze
You can find organizational level analytical tools in the Analyze menu within BEPA. Other analytical tools (i.e Actual vs Expected Profile Dashboard) are available at a location and meter level.
Actual vs Expected Profile Dashboard
The Actual vs Expected Profile dashboard and the Actual vs Expected (Profile) report can be run for either a location or a meter.
Energy Waste Cost
The Energy Waste Cost dashboard provides an overview of the cost of energy waste at both an organizational level, and a location level.
Energy Waste Issues
The Energy Waste Issues dashboard differs from Energy Waste Cost in the fact that Energy Waste Cost is derived exclusively from consumption variance alerts. In contrast, an Energy Waste Issue can be any demand or consumption notification. Energy Waste Issues do not quantify the value of energy waste, rather they are used to track and monitor how a facility and organization are responding and resolving energy issues.
Setting Alert Rules
BEPA uses rule based analytics to identify inefficiencies in your operations. There are three rule types used:
Email Notifications
When an issue is raised you can configure email notifications to be sent out to the nominated recipients.
Managing Issues
For details of how to manage issues in BEPA click here.