BEPA Cost Savings Potential
Cost Savings Potential
The Energy Waste Cost dashboard and the Cost Savings Potential field provides an overview of the cost savings opportunity at both an organizational level, location level and issue level. The financial cost of energy waste is calculated by summing the financial value of consumption variance (Unit Variance) Issues. Unit Variance is calculated when an Issue (or Related Item) is triggered. It's calculated by taking the difference between actual and expected consumption exceeds a nominated threshold percentage (%). Unit Variance is then calculated as the difference between the observed value and the expected value. For example:
A consumption variance rule is created to trigger if actual consumption exceeds 5% of the expected consumption over a 24 hour period for a given meter.
The expected consumption is 1,000 kWh, the actual consumption is 1,117 kWh. The threshold of 5% would allow consumption of up to 1,050 kWh before it was reported as an issue or related item. Therefore, the quantity of the unit variance is:
- (observed value) - (expected value)
- 1,117 kWh - 1,000 kWh
- = 117 kWh
The financial value (cost Savings Potential) is then calculated based on the following logic:
- Check nominal rate for the data type, at the location.
- if none exists
- Check unit rate attribute of the associate.
- if none exists
- Default the $/unit rate to $1 per unit
The financial value is stored for each related item. The values are then aggregated and reported via the Energy Waste - Cost dashboard and for each Issue.
Organizational Energy Waste Cost
The financial cost of energy waste is aggregated across the organization and presented in a dashboard. The dashboard has 6 main components:
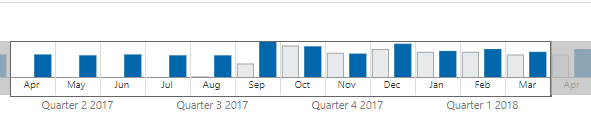
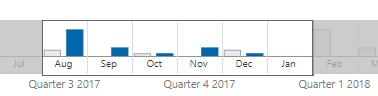
- Time navigator
- Summary statistics

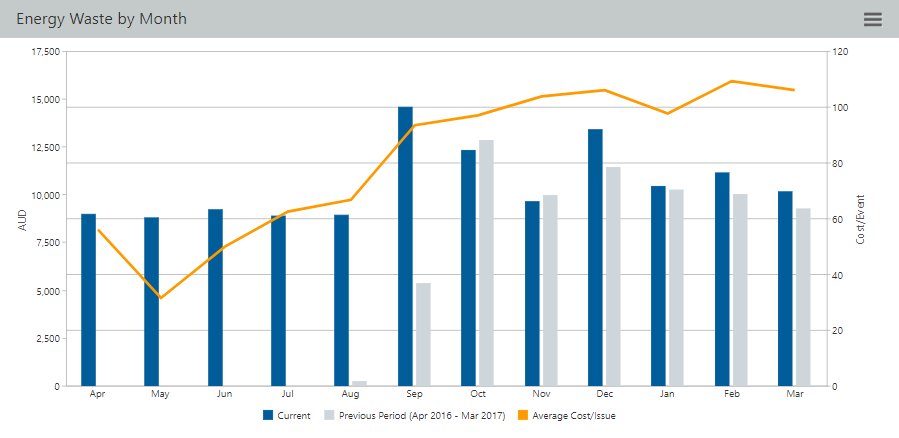
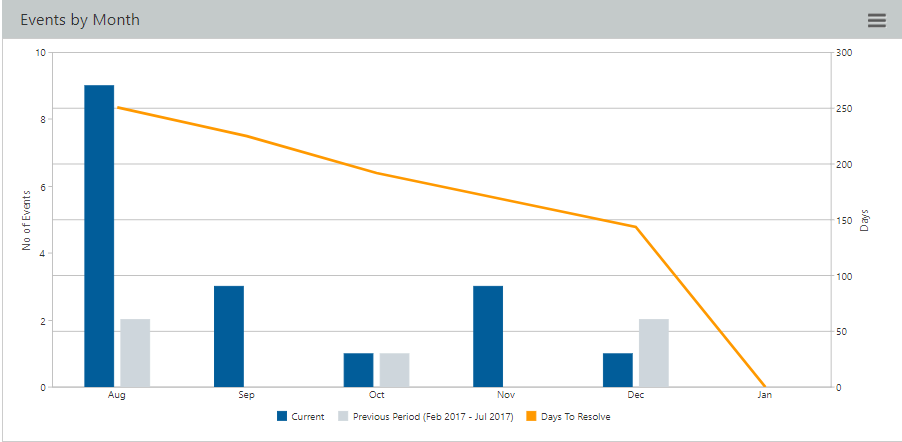
- Energy Waste by Month (Monthly Trends and comparisons)
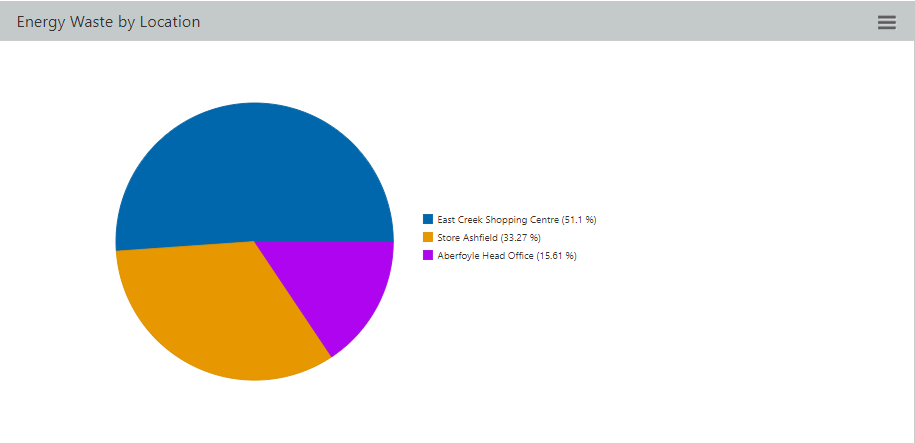
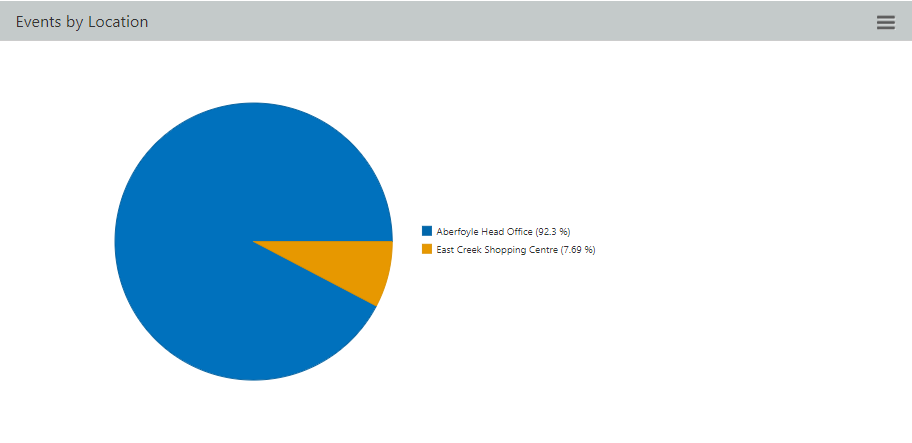
- Energy Waste by Location
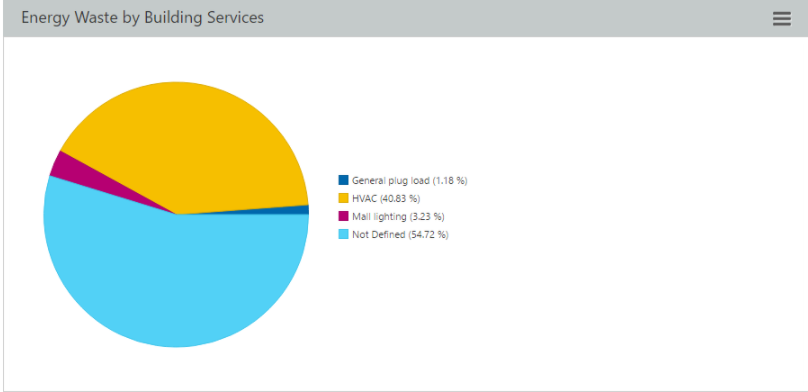
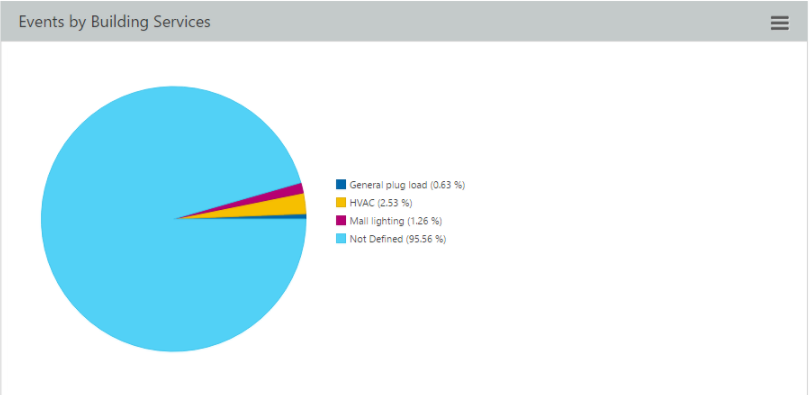
- Energy Waste by Building Services
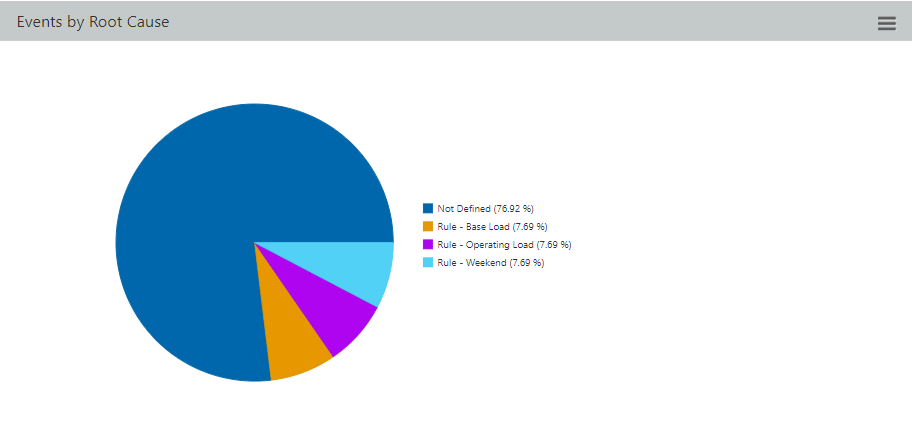
- Energy Waste by Root Cause
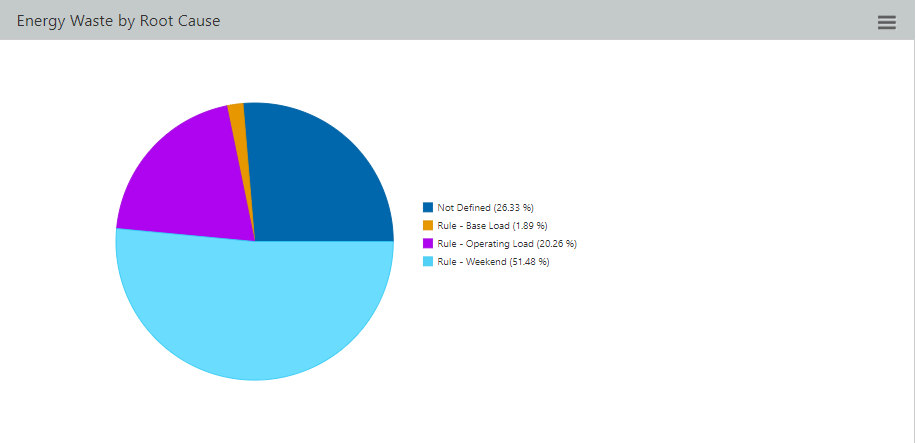
The pie charts shows the top 9 categories, the 10th and final category is an "other" category incorporating all other categories in the respective view.
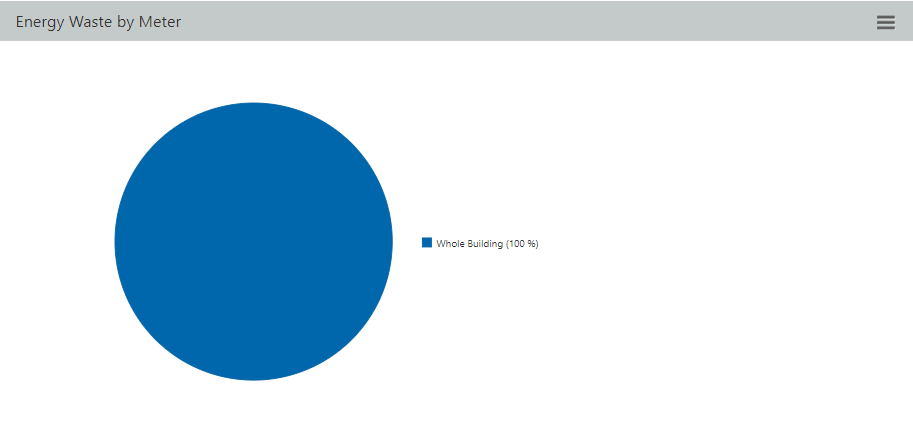
Location Energy Waste Cost
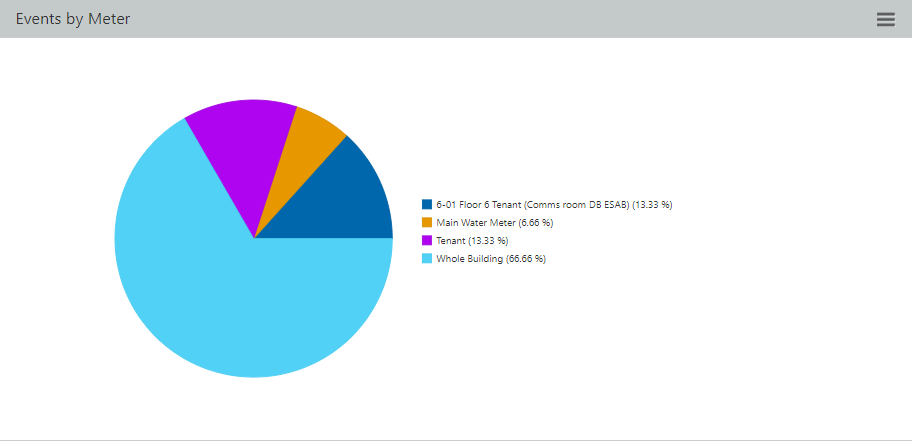
The financial cost of energy waste is aggregated across the location and presented in a dashboard. The dashboard has 6 main components as per the Organization version of the dashboard except that the Energy Waste by Location is replaced with an analysis of Energy Waste by Meter.
Energy Waste Issues
The Energy Waste Issues dashboard differs from Energy Waste - Costs in the fact that Energy Waste - Cost is derived exclusively from consumption variance alerts. In contrast, an Energy Waste Event can be any demand or consumption notification. Energy Waste Events do not quantify the value of energy waste, rather they are used to track and monitor how a facility and organization are responding and resolving energy events.
Organizational Energy Waste Events
The number of Energy Waste Events is aggregated across the organization and presented in a dashboard. The dashboard has 6 main components:
- Time navigator
- Summary statistics

- Energy Waste Issues by Month (Monthly Trends and comparisons)
- Energy Waste Issues by Location
- Energy Waste Issues by Building Services
- Energy Waste Issues by Root Cause
Location Energy Waste Issues
The number of Energy Waste Issues is aggregated across a location and presented in a dashboard. The dashboard has 6 main components as per the Organization version of the dashboard except that the Energy Waste by Location is replaced with an analysis of Energy Waste Issues by Meter.