Absolute Rules
An Absolute Rule is one based on a user defined absolute threshold for consumption and demand measures. An absolute threshold is a set trigger point defined by the user, for example if demand exceeds 20 kW within a given time period.
Step 1
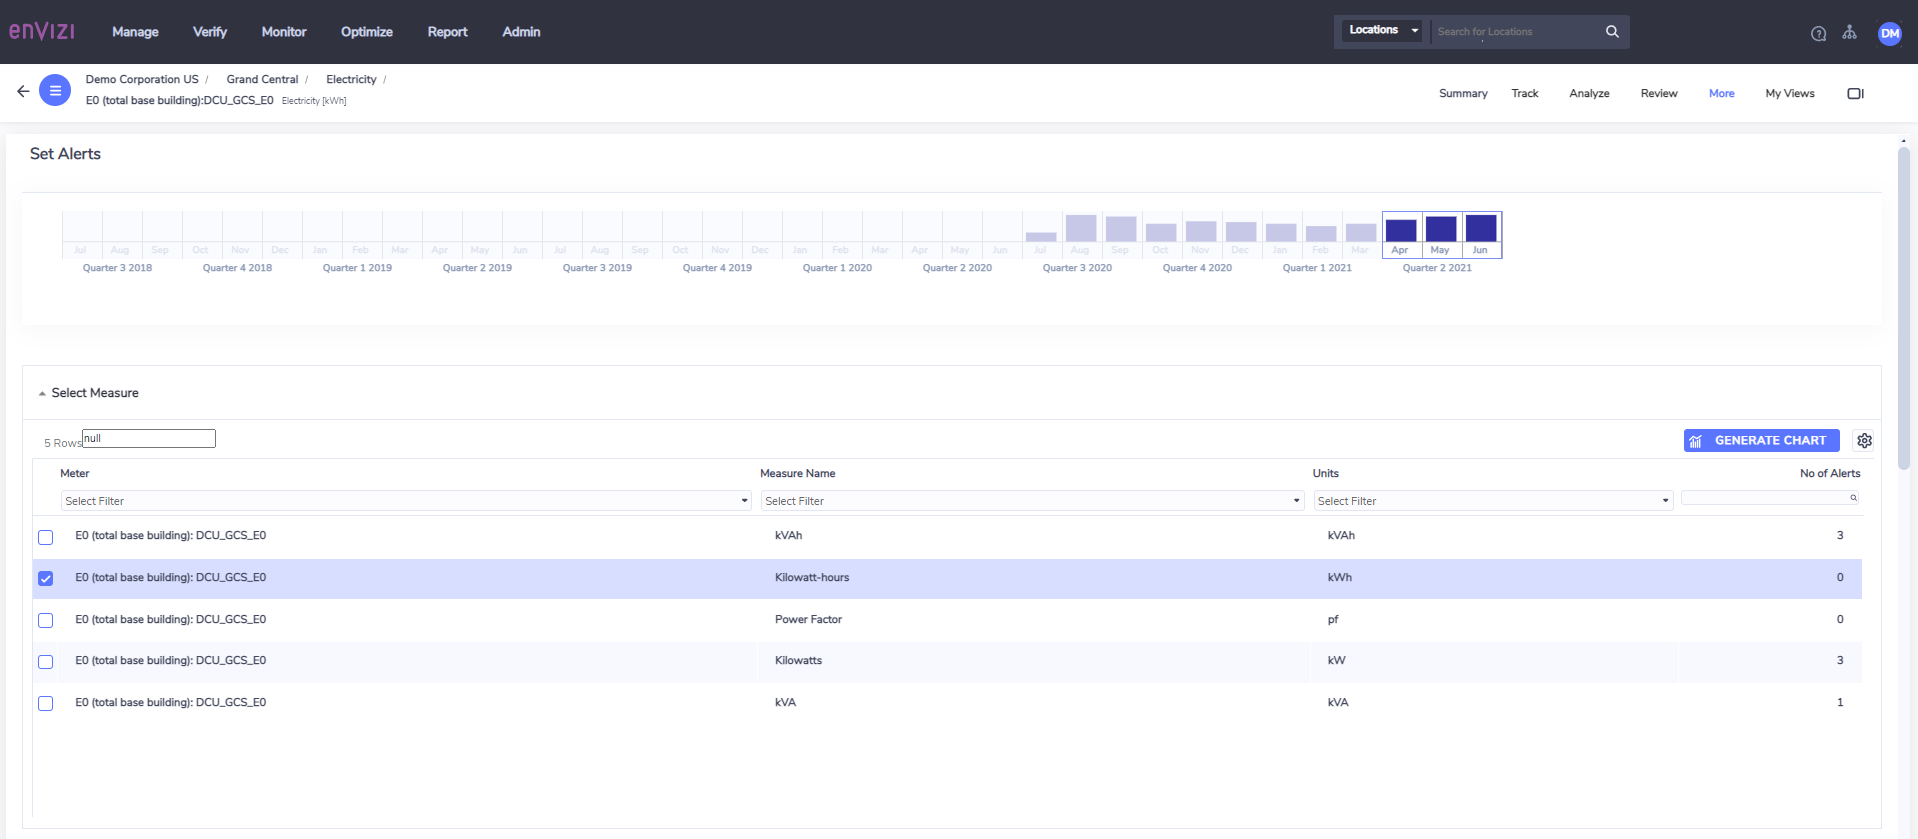
Data displayed in the Set Alerts dashboard or Absolute Rules (if navigating via the meter More menu) is based on the time horizon selected in the time navigator
Once you select the period of interest, the unit of measure needs to be selected from the Select Measure grid. Once you have selected the unit of measure, click the Generate Chart button
Step 2
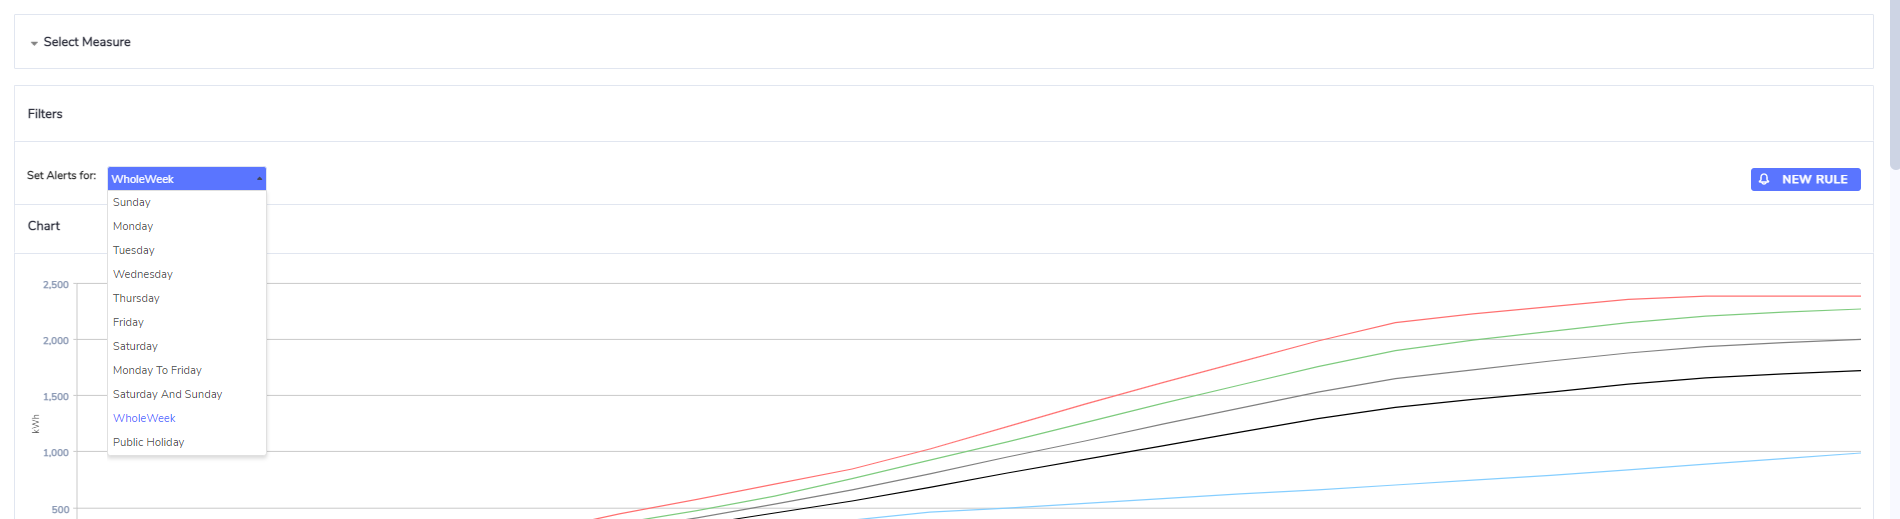
- You can set alerts for different periods within a given week; by default the data displayed on the alert rule screen is based on a whole week (Mon - Sun)
- You can select different time periods which will influence the data displayed. For example, if you select "Friday" the data will only represent Fridays across the period selected in the time navigator
- The alerts represented on the charts below do not currently change based on the day that has been selected
Step 3
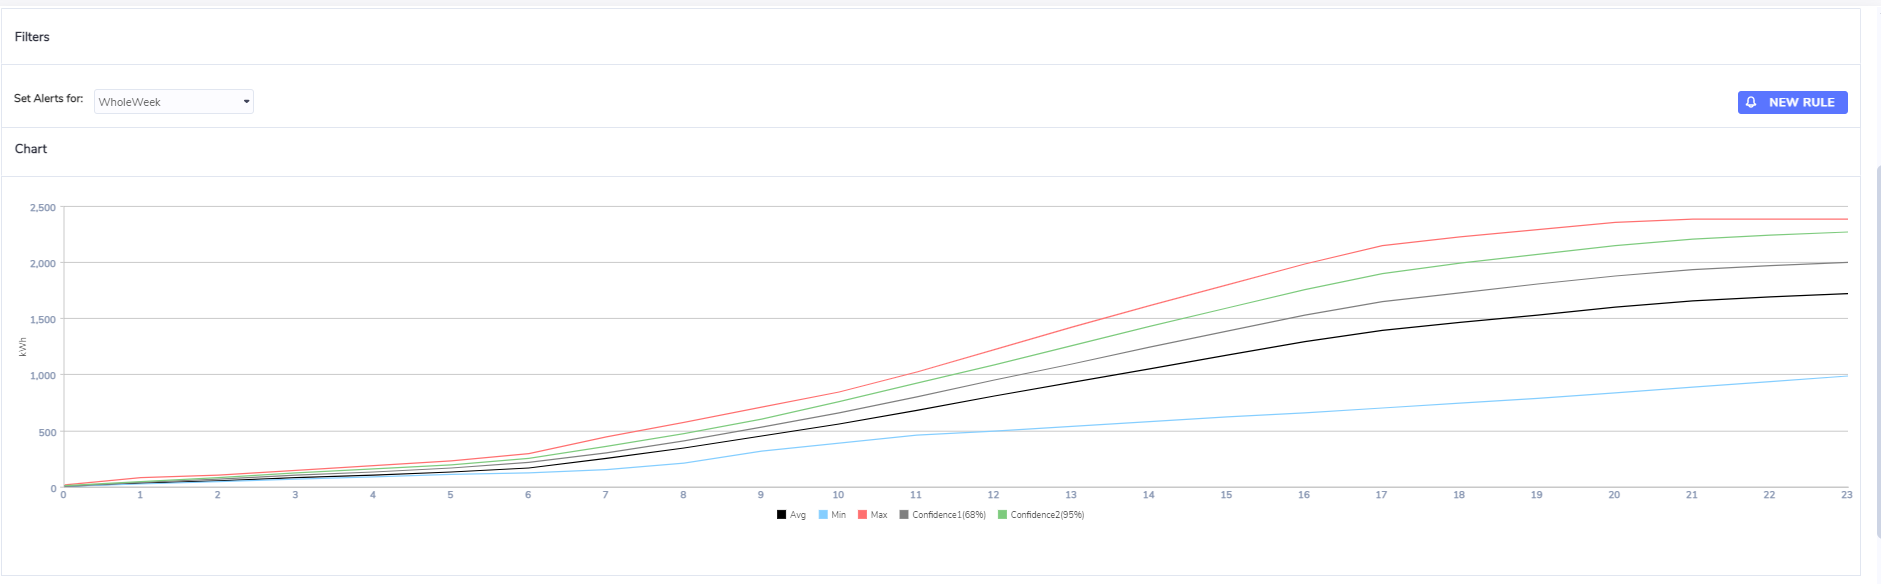
- Depending on the unit of measure selected, you will get one of two charts. If you select on consumption unit of measure then a cumulative Consumption chart will render, if a demand measure is chosen then a Demand profile chart will show.
- The cumulative Consumption chart displays kWh over a 24 hour period. The Demand chart shows kW over a 24 hour period
- There are 5 metrics shown on each graph:
- Average
- Min
- Max
- 68% confidence interval (1 standard deviation from the mean)
- 95% confidence interval (1.96 Standard deviations from the mean)
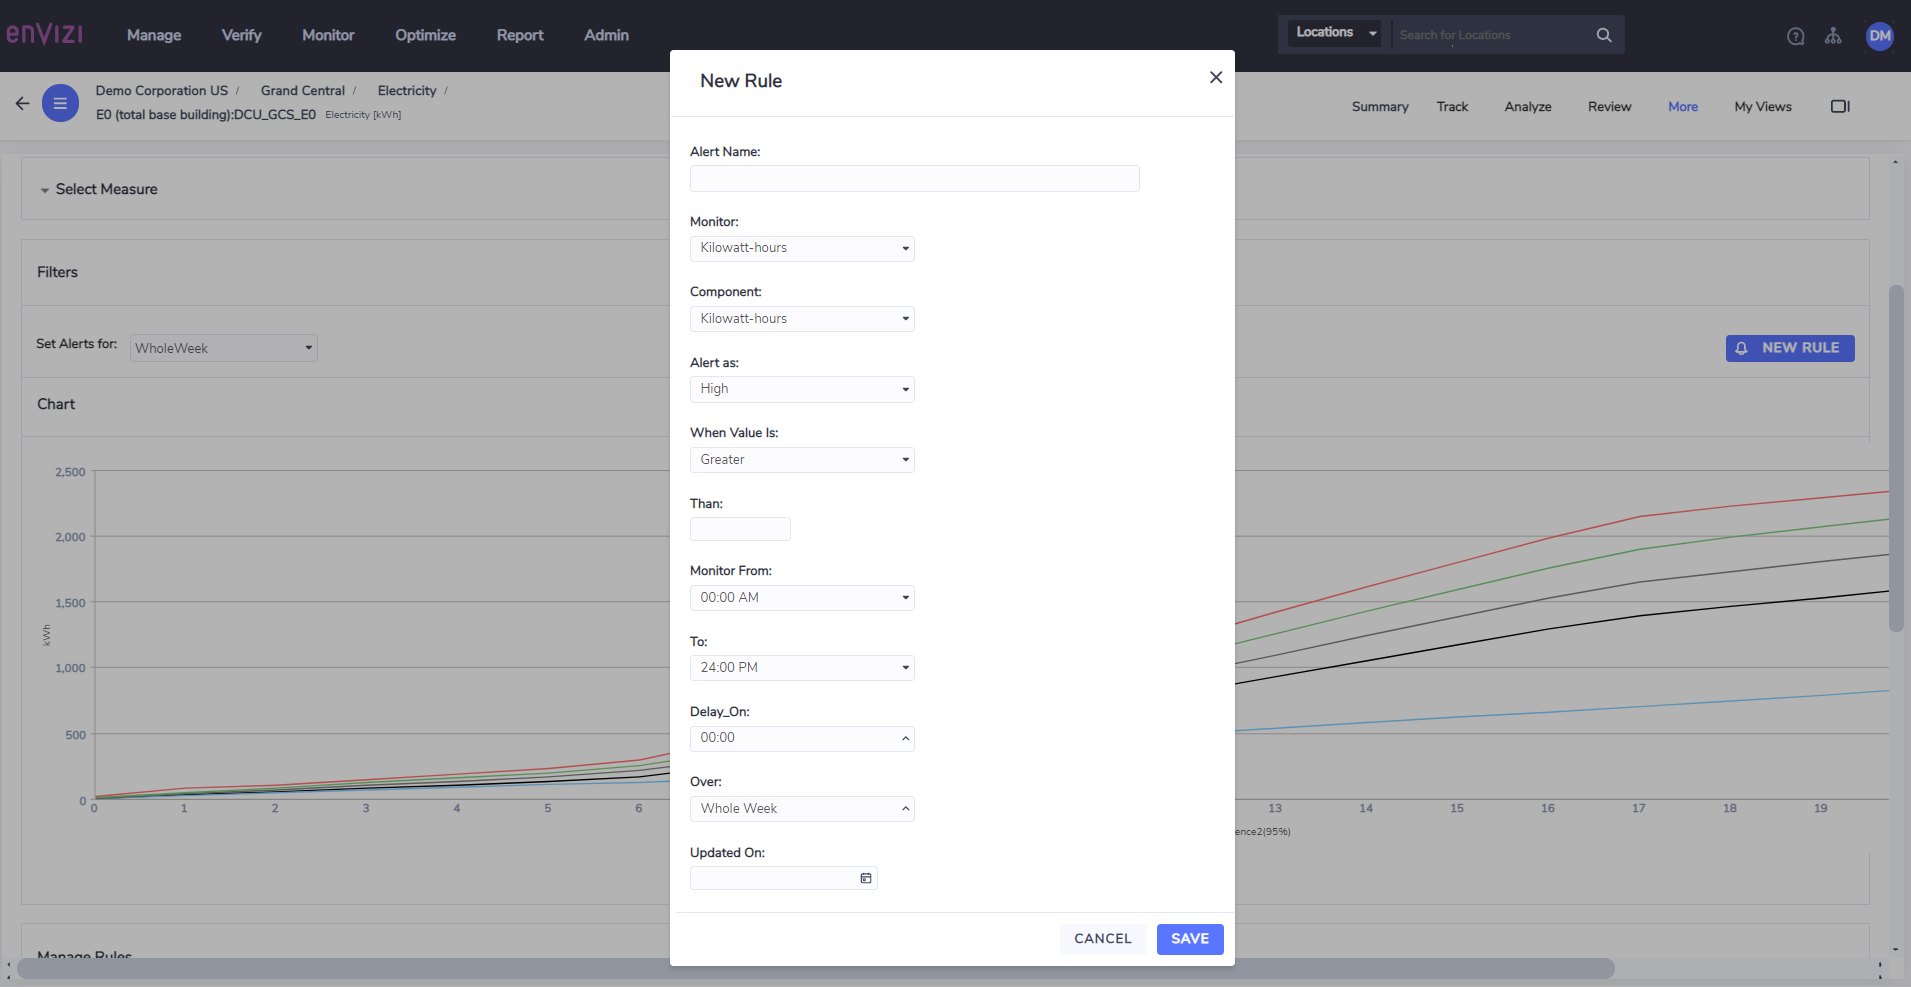
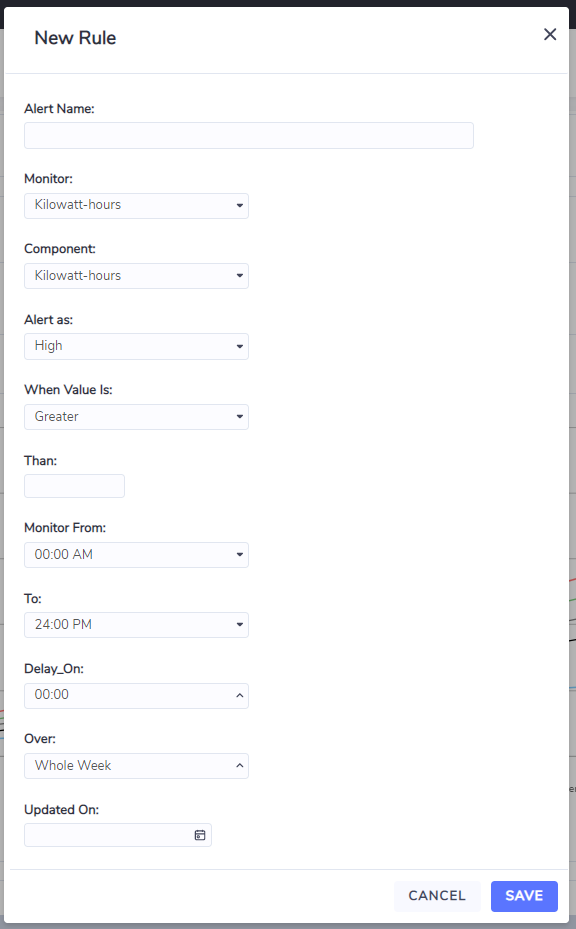
- To create a Consumption rule, you should click on the New Rule button on the left
- To create a Demand rule, you should click on the New Rule button on the right
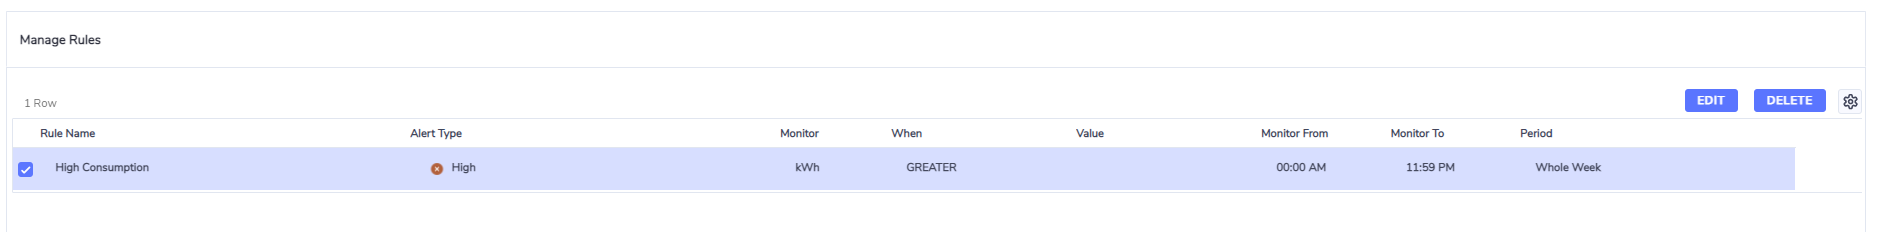
Step 4
- Once you have created a rule, it will be listed in the grid below the chart
- Rules can be edited or deleted using the links in the right hand columns
Create Consumption Rule
A consumption rule is when the cumulative consumption over a defined period of time exceeds a user defined threshold.
- Each alert must be given a name. It is recommend that the alert name be as specific as possible to provide meaningful context if the alert is triggered, e.g.:
- MSB 3 (Lighting and House Power) - excess overnight consumption
- If you click on the Consumption "New Rule" button, you will only have the option to create an alert for Consumption measures
- The Delay_On field is only applicable to demand alerts. See below for a description of when it's appropriate to use the Delay_On feature.
- Alerts will only show up on the graph if the time period defined is contained within a single day. If the time period being monitored covers two days
(e.g. 21.00-5.00) then the alert will not display on the graph, but the alert will be stored in the system
Create Demand Rule
A demand rule is when the instantaneous demand over a defined period of time exceeds a user defined threshold.
- Each alert must be given a name. It is recommend that the alert name be as specific as possible to provide meaningful context if the alert is triggered, e.g.:
- MSB 1 (chiller 1 and 2) - excess overnight base load
- If you click on the Demand "New Rule" button, you will only have the option to create an alert for Demand measures
- The Delay_On feature allows you to create a delay period on a demand alert. The delay period is measured in hours. For example, if you create a demand alert with
a threshold of 20 kW, and you select a Delay_On period of 3 hours, the alert will only trigger if demand is consistently held above the 20 kW threshold continuously
over a 3 hour period. If no Delay_On period is chosen, the alert will trigger if a given interval (e.g. 15 minute period) exceeds (or is less than) the nominated threshold. - Alerts will only show up on the graph if the time period defined is contained within a single day. If the time period being monitored covers two days
(e.g. 21.00-5.00) then the alert will not display on the graph, but the alert will be stored in the system

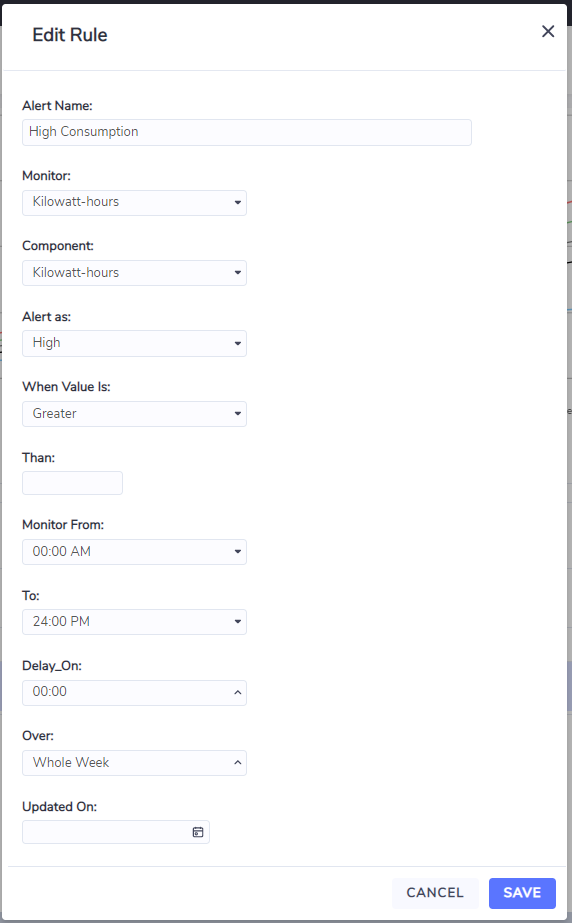
Edit Alert
- Once an alert has been created, you can edit it via the table below by selecting the alert and clicking on the edit button
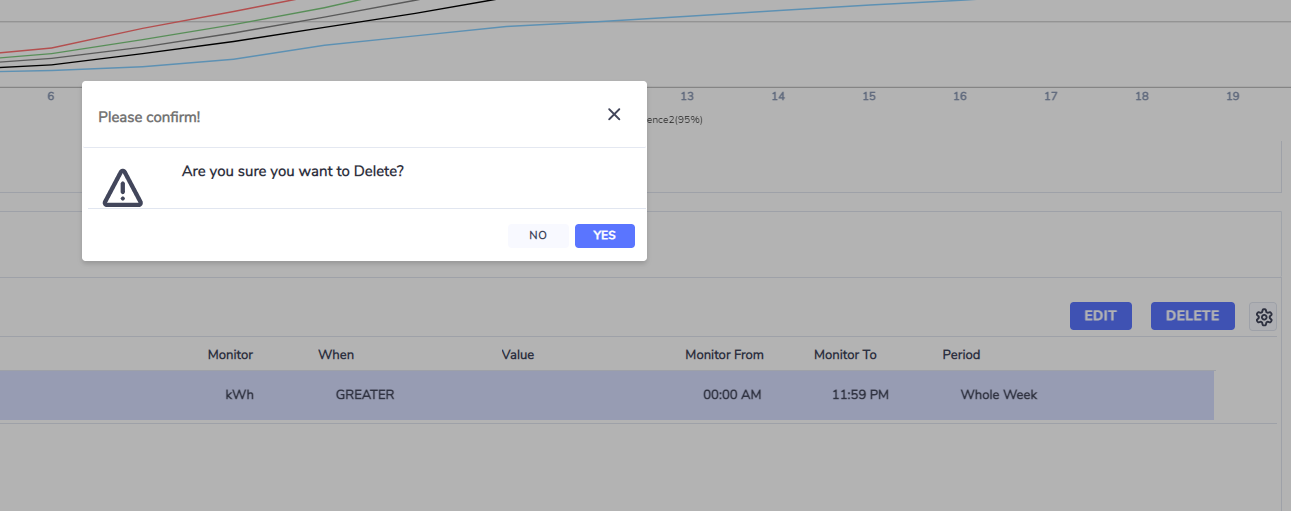
Delete Alert
To delete an alert, click the Delete link in the table. You will be prompted with a confirmation screen. To delete the alert, click Yes