BEPA Managing Issues
Location Overview
- The data presented via the stacked bars in the time navigator shows the relative frequency of Issues on a monthly basis
- The colors in the stacked bar represent the Issue types that have been triggered in a given month. The colors follow the same legend as the table below
- The time horizon selected in the time navigator dictates what data is shown in the table below

- The grid provides a summary of the Issues that have been triggered by the system, based on the user defined rules that have been configured
- Locations are ordered by default based on the total number of Issues. The number of Issues by priority is shown via a pie chart
- The Issue Trend shows the relative number of alerts for each week within the time window. (i.e. there are 4 data points per month)
- Each location reports the number of alerts in a given status (Raised, Investigating and Resolved)

- To view the details on individual Issues within a location, click on the "View Details" link

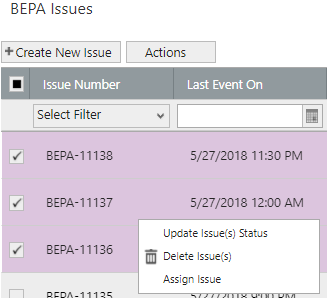
BEPA Issues
- The first screen you see when navigating from the "View Details" link is BEPA Issues
- BEPA Issues provides a view of all energy waste Issues
- Issues are listed in date order, however the grid can be re-ordered using the filter functions

Additional columns can be displayed in the grid by using the grid settings icon on the top right hand side of the grid. You can added and remove columns by checking/unchecking the selection box.

In the right hand side preview panel you can see various information related to the issue you have selected:
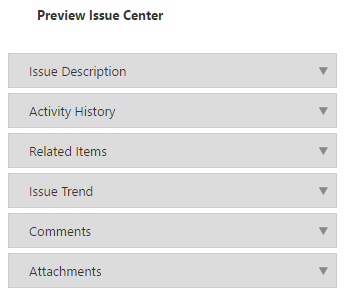
- Issue Description : This provides a brief description of the issue.
- Activity History: This provides an historical summary of activity captured within the issue. For example, if the status has been changed, if the assignee has changed, etc.
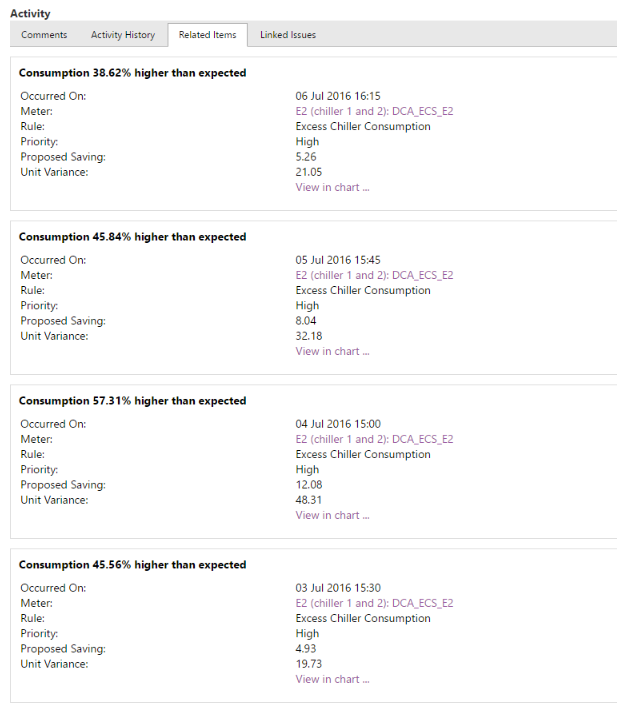
- Related Items : Related Items shows the log of alerts that are associated with a given issue. Each Related Item is an instance when an alert has been triggered.
- Issue Trend : The Issue Trend provides a summary of the time of day and trigger value of all the Related Items in a scatter plot view.
- Comments : Displays Comments captured against the issue, listed in most recent to oldest.
- Attachments : Shows any Attachments added to the issue.
From the Issues grid you can take various actions:
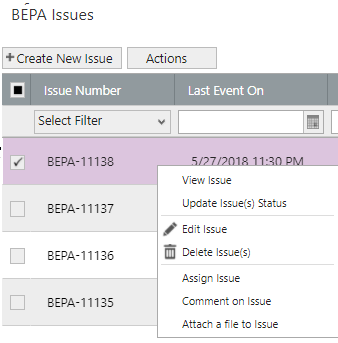
View Issue
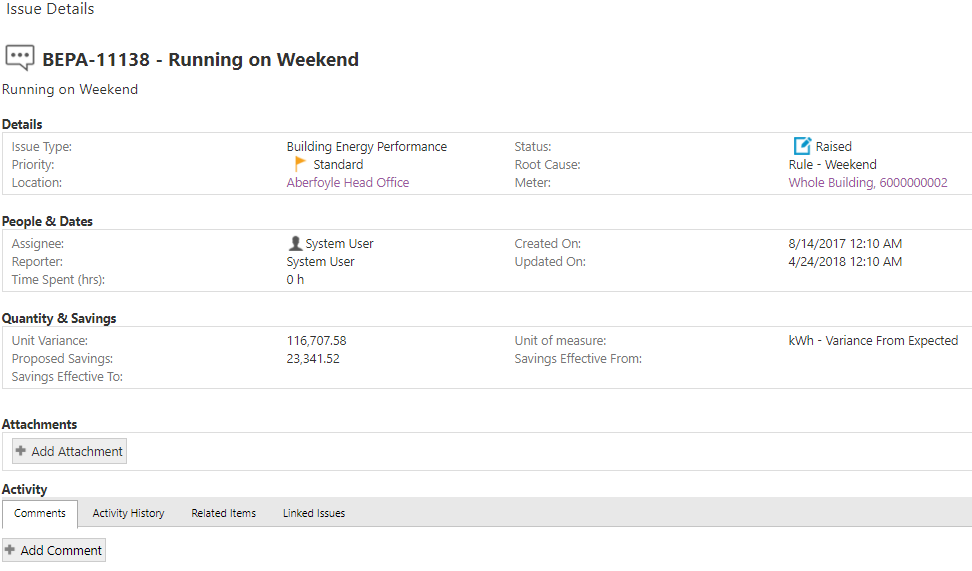
The Activity of an issue can be viewed via the following activity themes:
Comments
- Displays all comments from most recent to oldest
Activity History
- A combined chronology of issue activity
Related Items
- Related Items are invidual instances when an alert (associated with a given issue) is triggered by the system.
- The Related Item can be viewed by clicking the "View in chart ..." link at the bottom of the item.
- A user can also go to the "Meter Summary" page by selecting the meter link
Linked issues
- This feature is not currently supported.
Edit Issue
You can edit the following fields:
Details
- Issue Type
- Priority
- Location
- Meter
- Status
- Root Cause
- Area of Impact
People and Dates
- Assignee
- Reporter
- Time Spend (hrs)
- Created On
- Updated On
Quantity & Savings
- Unit Variance
- Proposed Savings
- Savings Effective To
- Unit of measure
- Savings Effective From
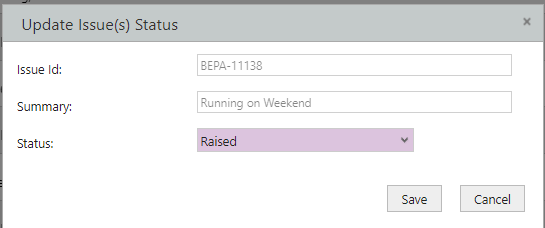
Update Issue Status
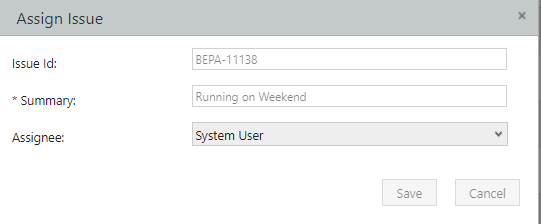
Assign Issue
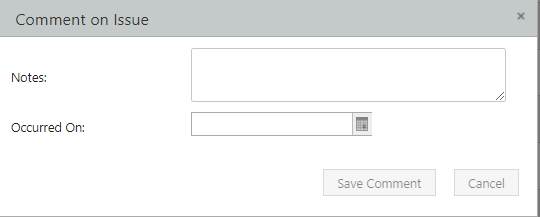
Comment on Issue
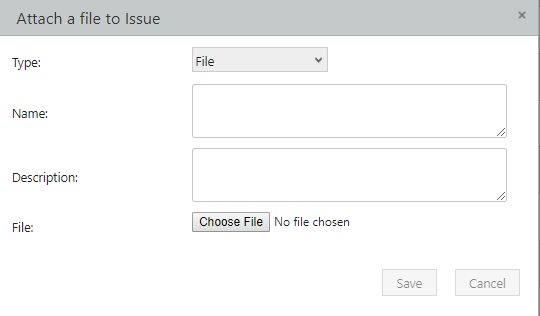
Attach File to Issue
Bulk Update
BEPA issues can be updated in bulk. The bulk update feature is available for the following fields:
- Assignee
- Status
The delete function is also supported as a bulk action.
To bulk update/edit issues, you must select the relevant issues by ticking the check box. Once you have selected the relevant issues, right click and the supported action/s will appear. Select the action you want to perform, make the changes then click Save. All selected issues will then be updated with chaneg you made.
