BEPA Variance Rules
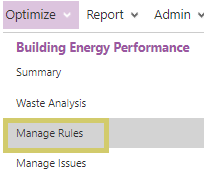
You can manage BEPA variance rules from the Optimize main menu under Building Energy Performance
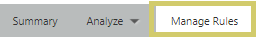
or if you already in BEPA, you can click on the Manage Rules sub-menu.
Managing Rules
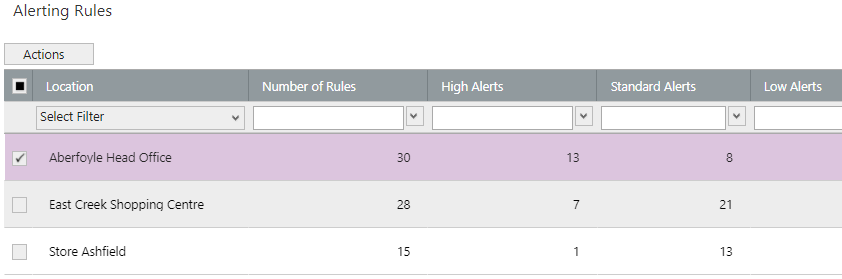
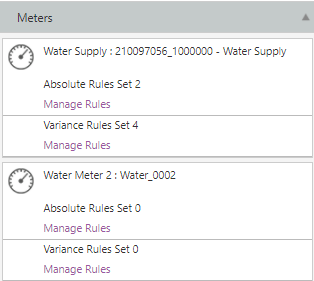
- In the grid you will see all locations that have an expected profile for at least one meter
- The grid includes location name, number of rules created and a break down of alerts by type
- You can find the location you are interested in by scrolling to find the location or by using the search function within the grid
- Once you have selected the row you are interested in, expand the right hand preview panel to see the list all the meters at your location
- You can scroll through the list to navigate to your meter of interest to you
- You can then select Manage Rules to create or edit an absolute or variance based alert
You will be taken to the Set Alerts page. Data displayed this page is based on the time horizon selected in the time navigator
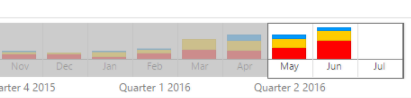
The data displayed in the stacked bar chart in the time navigator reflects the number and type of alerts triggered in a given month
- The stacked bars are represented by the following legend
- Red = High priority alerts
- Yellow = Standard priority alerts
- Blue = Low priority alerts
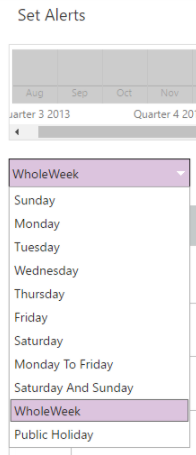
Alerts can be set for different periods within a given week; by default the data displayed on the alert rule screen is based on a whole week (Mon - Sun)
- Different time periods can be selected which will influence the data displayed. For example, if you select Friday the data will only represent Fridays
across the period selected in the time navigator. The alerts represented on the charts below do not currently change based on the day that has been selected
Charts
There are two primary charts.
The chart on the left hand side is a cumulative expected Consumption chart. The cumulative Consumption chart shows kWh over a 24 hour period.
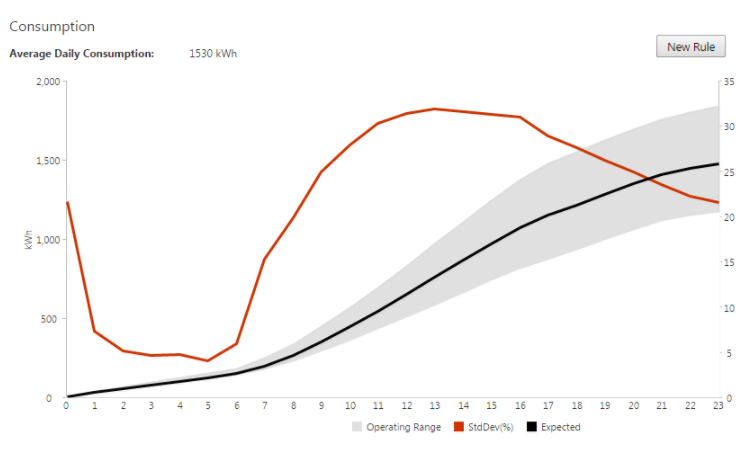
- To create a Consumption rule, you should click on the New Rule button on the left
The chart of the right is the Demand profile. The Demand chart shows kW over a 24 hour period.
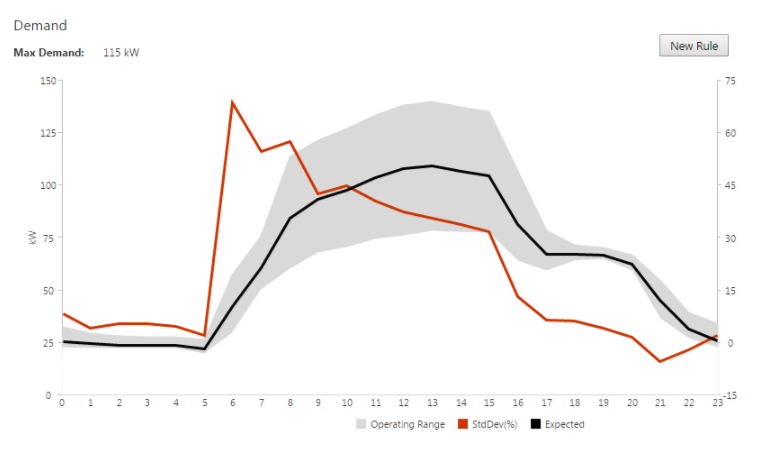
- To create a Demand rule, you should click on the New Rule button on the right
There are 3 metrics shown on each chart:
- Expected
- Operating Range
- Std Dev (%)
- The Std Dev (%) is the 68% confidence interval (1 standard deviation from the mean) of the variation between the actual and expected performance.
- Std Dev (%) can be a negative number, as the average variation can be negative (i.e actual performance is on average better than expected).
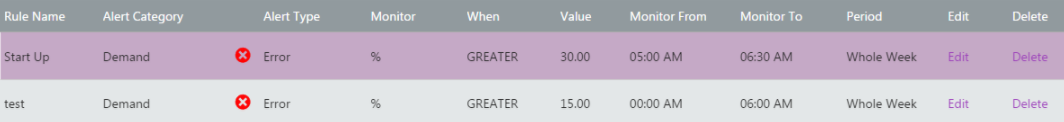
- Once you have created an alert, it will be listed in the grid below the charts
- Alerts can be edited or deleted using the links in the right hand columns