
Sustainability Dashboards and Features
Envizi’s Sustainability Data Management and Reporting module allows you to leverage powerful automation tools to easily capture sustainability data across your organization and transform it into a single system of record.
This module includes several dashboards focused on GHG emissions reporting and provides a collection of reports.
Dashboards & Gadgets
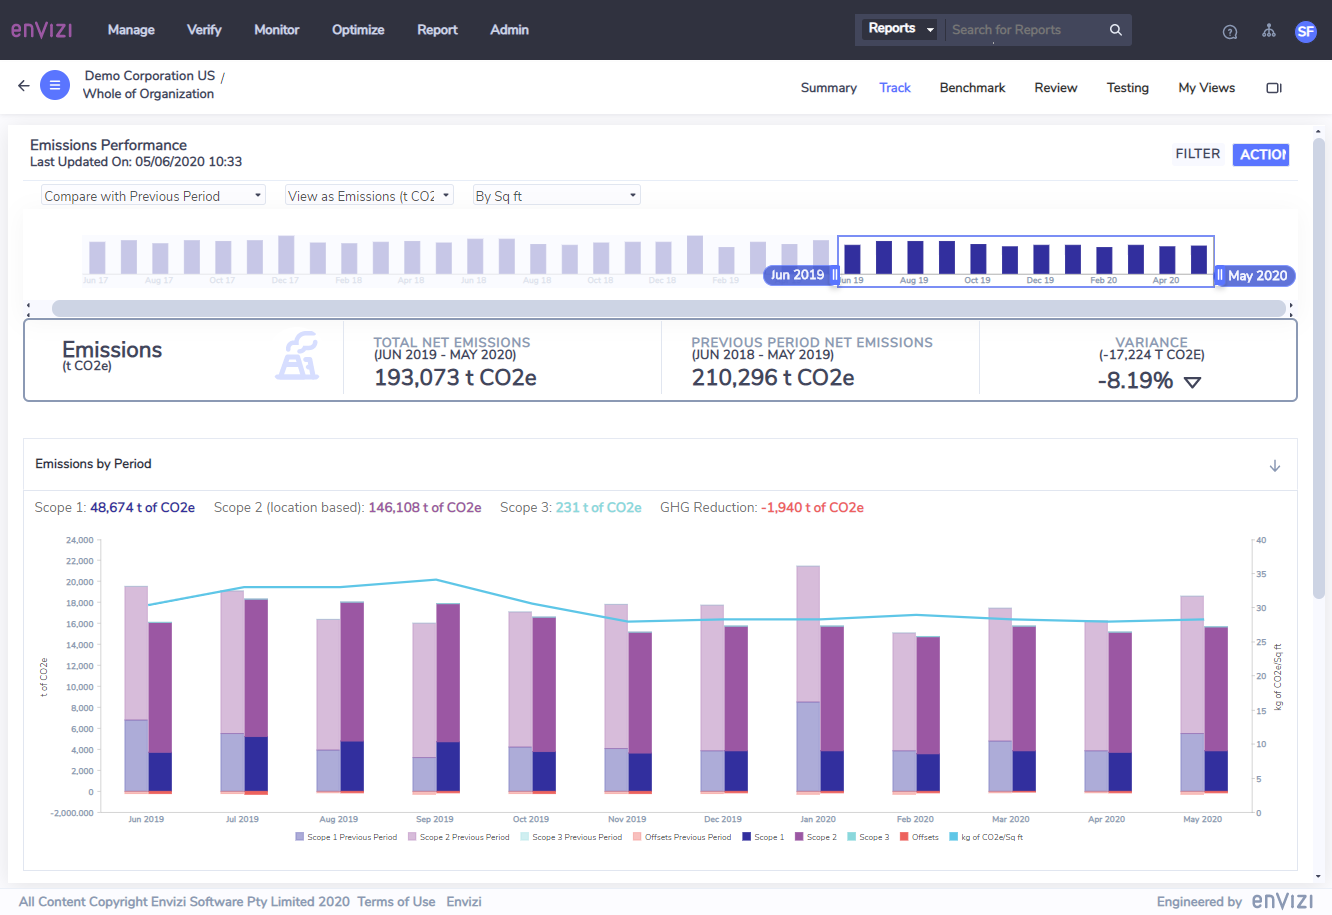
Emissions Performance Dashboard - Shows a breakdown of emissions by scope, including GHG reductions, emissions intensity and a breakdown of emissions by location. This dashboard is only available to clients using the Envizi 'Data Mart'. Contact your Account Manager if you would like this dashboard turned on.
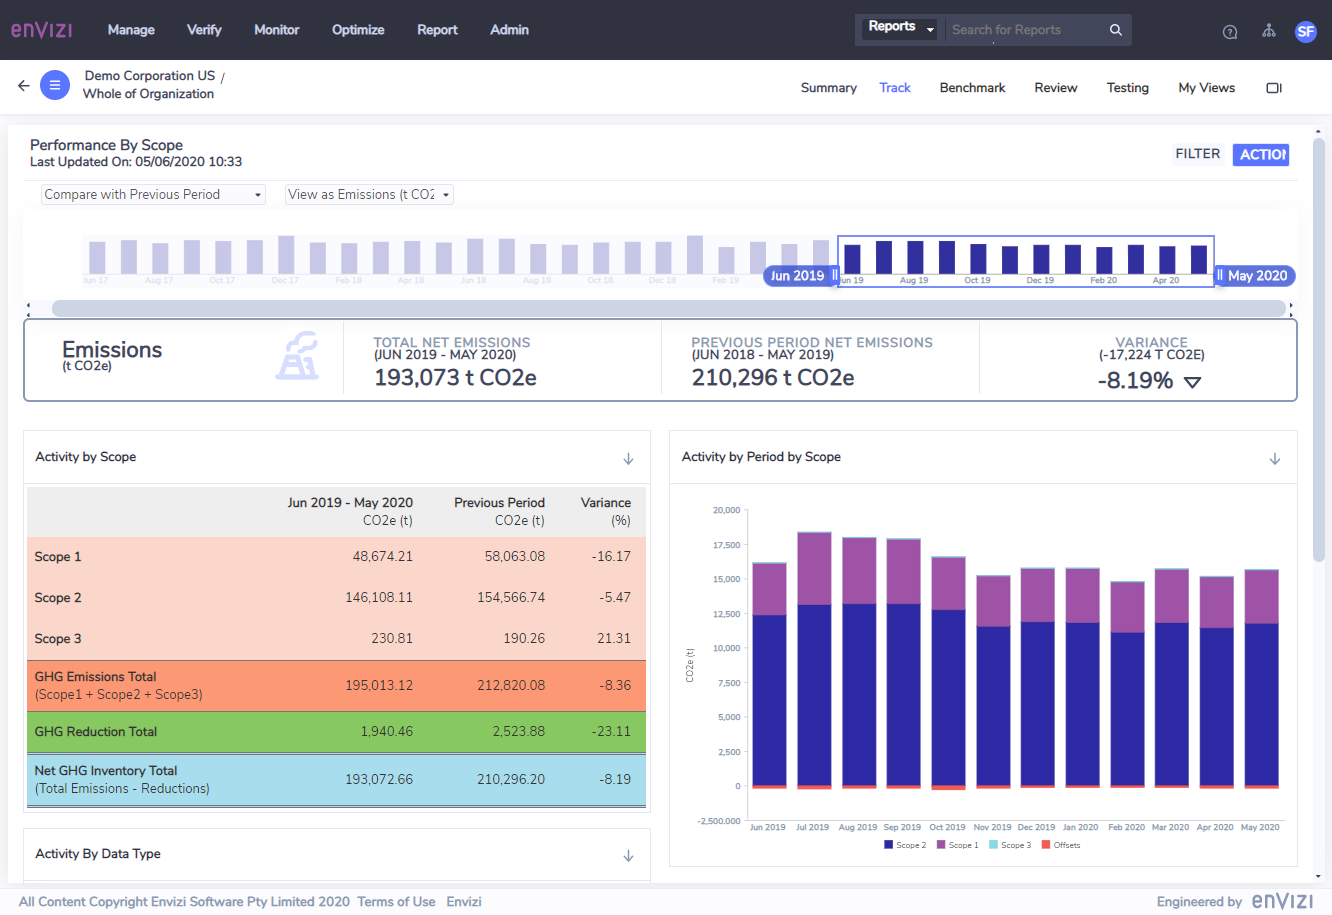
Performance by Scope Dashboard - Shows a breakdown of emissions by scope, including GHG reductions and a ranking of emissions by data type. This dashboard is available to all organizations.
Other Features
Market-based Emissions PowerReport - This report summarizes emissions from Scope 2 market-based and location-based electricity as well as an accounting of all types of energy attributes including national renewable energy quotas, green power, RECs, GOs and other renewable energy instruments. A financial analysis is provided to estimate the cost of achieving net zero emissions for electricity across your organization. Finally a detailed view of energy attribute apportionment and underlying emission factors is included which is useful for auditors. Please contact Envizi to have this report enabled as some additional configuration is required.
Scope 3 Reporting - This page outlines how to categorize, manage and report on your Scope 3 emissions in a way that aligns with the GHG Protocol's Scope 3 reporting framework. This page also explains how we treat electricity and natural gas transmission and distribution losses.
Custom Factor Management - This page will demonstrate how to manage custom emissions factors for your organization.
Factor Audit and Review - This page outlines the methodology used to audit and review managed emission factors in Envizi. Auditors will often ask for Envizi's process for managing factors so this document can be shared with them when requested.
Factor Published Date Logic - This page describes the additional logic required to apply factors to historical data without performing an emissions recalculation. Organizations must opt-in if they wish to make use of this feature.
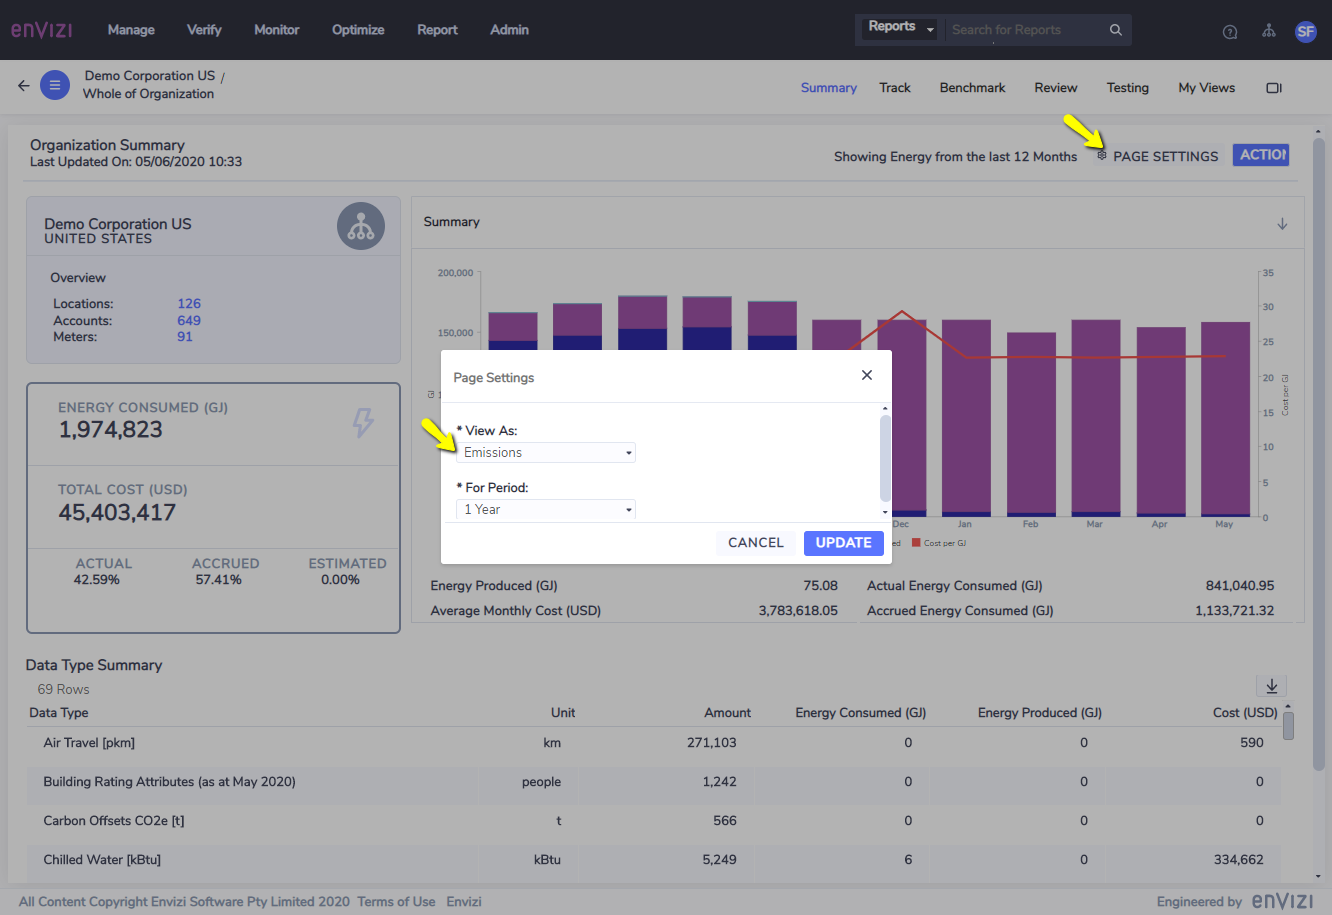
All Summary pages in Envizi will also have a customized emissions-focused version. This can be enabled by clicking the Settings button at the top-right of the Summary page and selecting "Emissions".
Reports
Reports containing sustainability information on energy consumption and emissions produced across groups, locations, accounts and meters.
Report Name | Description |
|---|---|
Consumption Summary | The Consumption Summary report provides a comprehensive review of the CO2e attributable to a location. Contents: A snap-shot of consumption (CO2e) by data type. This graph highlights the key contributors to the location’s GHG inventory trend graphs. |
Custom Emission and Energy Factors | This report lists custom factors used to calculate the GHG emissions and energy consumed or produced within your organization. This report will only appear if your organization manages their own custom emission factors. |
Emission and Energy Factors | This report lists the factors used to calculate the GHG emissions and GJ of energy consumed or produced within your organization. |
Emission Sources by Groups [Scope 1 +2] | This report provides the consumption and emissions data covered under NGERs organised by group. |
Emission Sources by Location | This report shows how much was consumed (kWh, L of fuel, etc.) at one location and how much CO2e was emitted as a result. The report shows a monthly comparison to allow trends to be identified. |
Emission Sources by Location [Scope 1 + 2] | This report provides uncertainty values for source data and aggregated to the location and company level required by OSCAR and EERS. |
Emission Sources by Scope | Emission Sources by Scope Report shows the split of emissions by scope 1, 2 and 3 classifications. Contents: A snap-shot of CO2e by scope. This graph highlights the key contributors to the GHG inventory by scope |
Emission Sources Summary | This report shows how much was consumed (kWh, L of fuel, etc.) at all locations and how much CO2e was emitted as a result. |
Energy and CO2e by Account | This report provides usage, energy and CO2e by account or meter. |
Energy Consumption by Location | This report provides a comprehensive review of the energy used in the selected location. A snap-shot of Energy by Source graph highlights the key contributors to the location’s energy usage. This report shows how much was consumed (kWh, L of fuel, etc.) at one location and how much GJ of energy that represents. |
Energy Consumption Detailed | This report shows activity data in native units and energy in GJ for all locations across your organization. |
Energy Consumption Detailed by Group | This report shows activity data in native units and energy in GJ for all groups across your organization. |
Energy Consumption Detailed by Site | This report provides detailed energy consumption information for a selected location. The first page provides a graphical summary of the total CO2e by month from Electricity and Natural Gas for the selection, and the total CO2e. The second page provides details of natural gas usage in gigajoules (GJ) and associated GHG emissions in CO2e. The third page provides a breakdown of the peak, off peak and shoulder electricity used, total kilowatts and associated GHGs emitted in CO2e. Gas and electricity consumption and CO2e are provided for each location that is part of the organisation or the group. The data tables on the second and third page include data from both selected period and the same period in previous year. The final page provides information on the CO2e avoided through purchasing Green Power. |
This report summarizes emissions from Scope 2 market-based and location-based electricity as well as an accounting of all types of energy attributes including national renewable energy quotas, green power, RECs, GOs and other renewable energy instruments. A financial analysis is provided to estimate the cost of achieving net zero emissions for electricity across your organization. Finally a detailed view of energy attribute apportionment and underlying emission factors is included which is useful for auditors. Please contact Envizi to have this report enabled as some additional configuration is required. |