
Emissions Performance Dashboard
The Emissions Performance dashboard shows your GHG emissions broken down by scope, direct emissions, indirect emissions and individual gases (CO2, CH4 and N2O).
This dashboard can be found in the 'Monitor' main menu under 'Performance'. It will also appear under the 'Track' menu at the organization and group level. This dashboard is not available at the location, account or meter level.
Dashboard
Chart - Emissions by Period
This chart to shows GHG emissions over time, emissions intensity by KPI, and show a breakdown of individual GHG Scopes. Currently the comparison period will change the summary box and the grid accessed through the chart. A comparison against the previous period is also available.
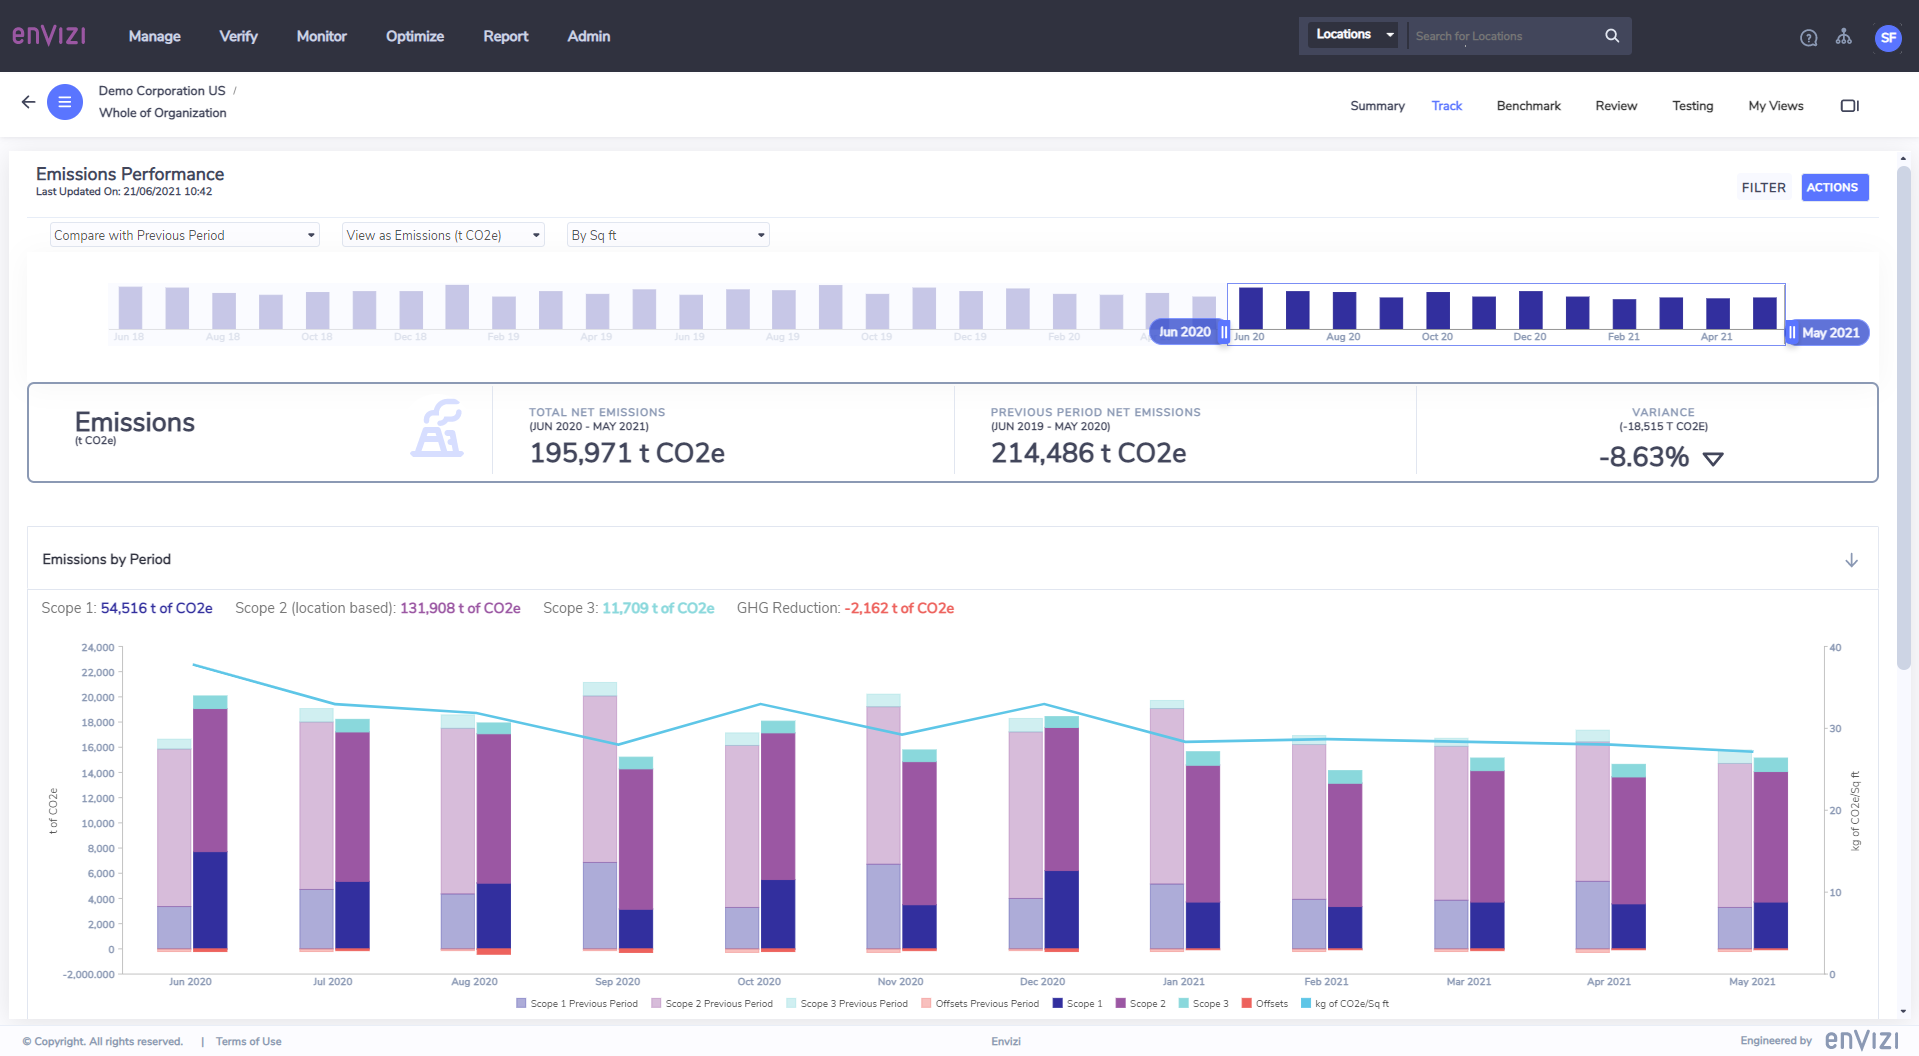
Features:
View as restricted to Emissions, available in t CO2e and kg CO2e
KPIs to show intensity are selectable in the dropdown above the time navigator. Intensity units of measure are shown on the 2nd y-axis on the right-side.
Summary boxes show current emissions, previous emissions and variance.
Totals are shown above the bars, each color coded to match the contents of the bar chart.
Emissions data broken down by GHG Scope, including GHG Offsets.
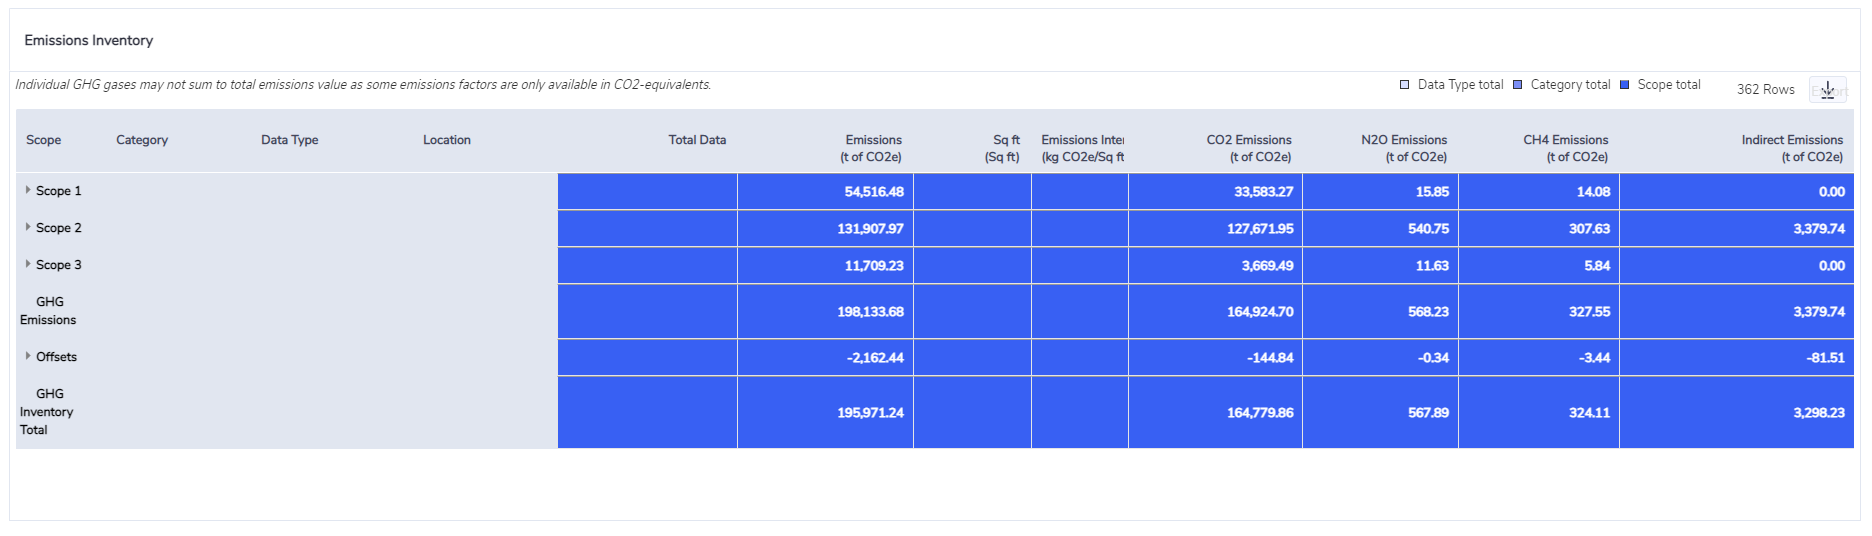
Tree Grid - Emissions by Scope, Category, Data Type and Location
Lifecycle emissions
Lifecycle emissions are defined as the complete emissions profile of an activity which includes the direct component (eg. burning of fuels or consumption of electricity) as well as the indirect component, which includes upstream and downstream emissions. For example, in the case of electricity consumption there are emissions associated with transmission and distribution losses. Likewise with Scope 1 fuels there are emissions associated with the extraction, processing, manufacture and delivery of the fuel. These losses are represented in the ‘Scope 3 Indirect’ column.
Indirect emissions are technically classified as Scope 3, but they differ from other Scope 3 sources because they result from activities that also produce Scope 1 and 2 emissions. To avoid duplicating account data and to show the link between the direct and indirect emissions, these indirect Scope 3 emissions have been included as a column in the grid rather than additional rows.
To determine total Scope 3 emissions for your organization simply sum the values in the ‘Emissions’ column for Scope 3 with the total values in the ‘Scope 3 Indirect’ column.
Lifecycle emissions can also be viewed in the Category Analysis page in the Scope 3 Emissions Analysis PowerReport.
This tree-grid in a table that shows pivoted and summed data. In this case we are showing Emissions grouped by Location, Data Type, Category and finally Scope. The tree-grid opens with all groupings collapsed, and they can be expanded by using the arrow controls found in the Scope column.
Features:
4 levels of groupings available: Scopes, Category, Data Type and Locations
Scope: This includes Scope 1, Scope 2, Scope 3 and GHG Reductions (which includes Offsets and Renewable Energy Certificates)
Category: This includes groupings of data types such as Transport Fuels, Electricity, Natural Gas, Refrigerants, etc...
Quantities are summarized when expanding the tree-grid to the Data Type level (as aggregating above this would result in adding together different units of measure)
Scope 3 Indirect Emissions represents the upstream and downstream emissions for each emission source.
Emissions are be viewed in tonnes or kilograms, depending on the View As dashboard selection at the top.
Emissions intensity is also affected by the View As selection, as well as the KPI selected. If no KPI is selected or available, then the KPI and Emissions Intensity columns will not display
Individual GHG Gases are displayed, showing the total CO2e for each gas.
Sometimes the sum of individual gases will not add up to total Emissions.
This is because emission factors are sometimes only available in CO2e and not provided in CO2, CH4 and N2O and this can cause a mismatch when summing across locations and regions.