
Scope 3 Emissions Analysis - Category Analysis
There are 15 Category Analysis pages, each one pertaining to the data within a specific category. These pages are identical except for Category 3, which has some unique treatments, explained below.
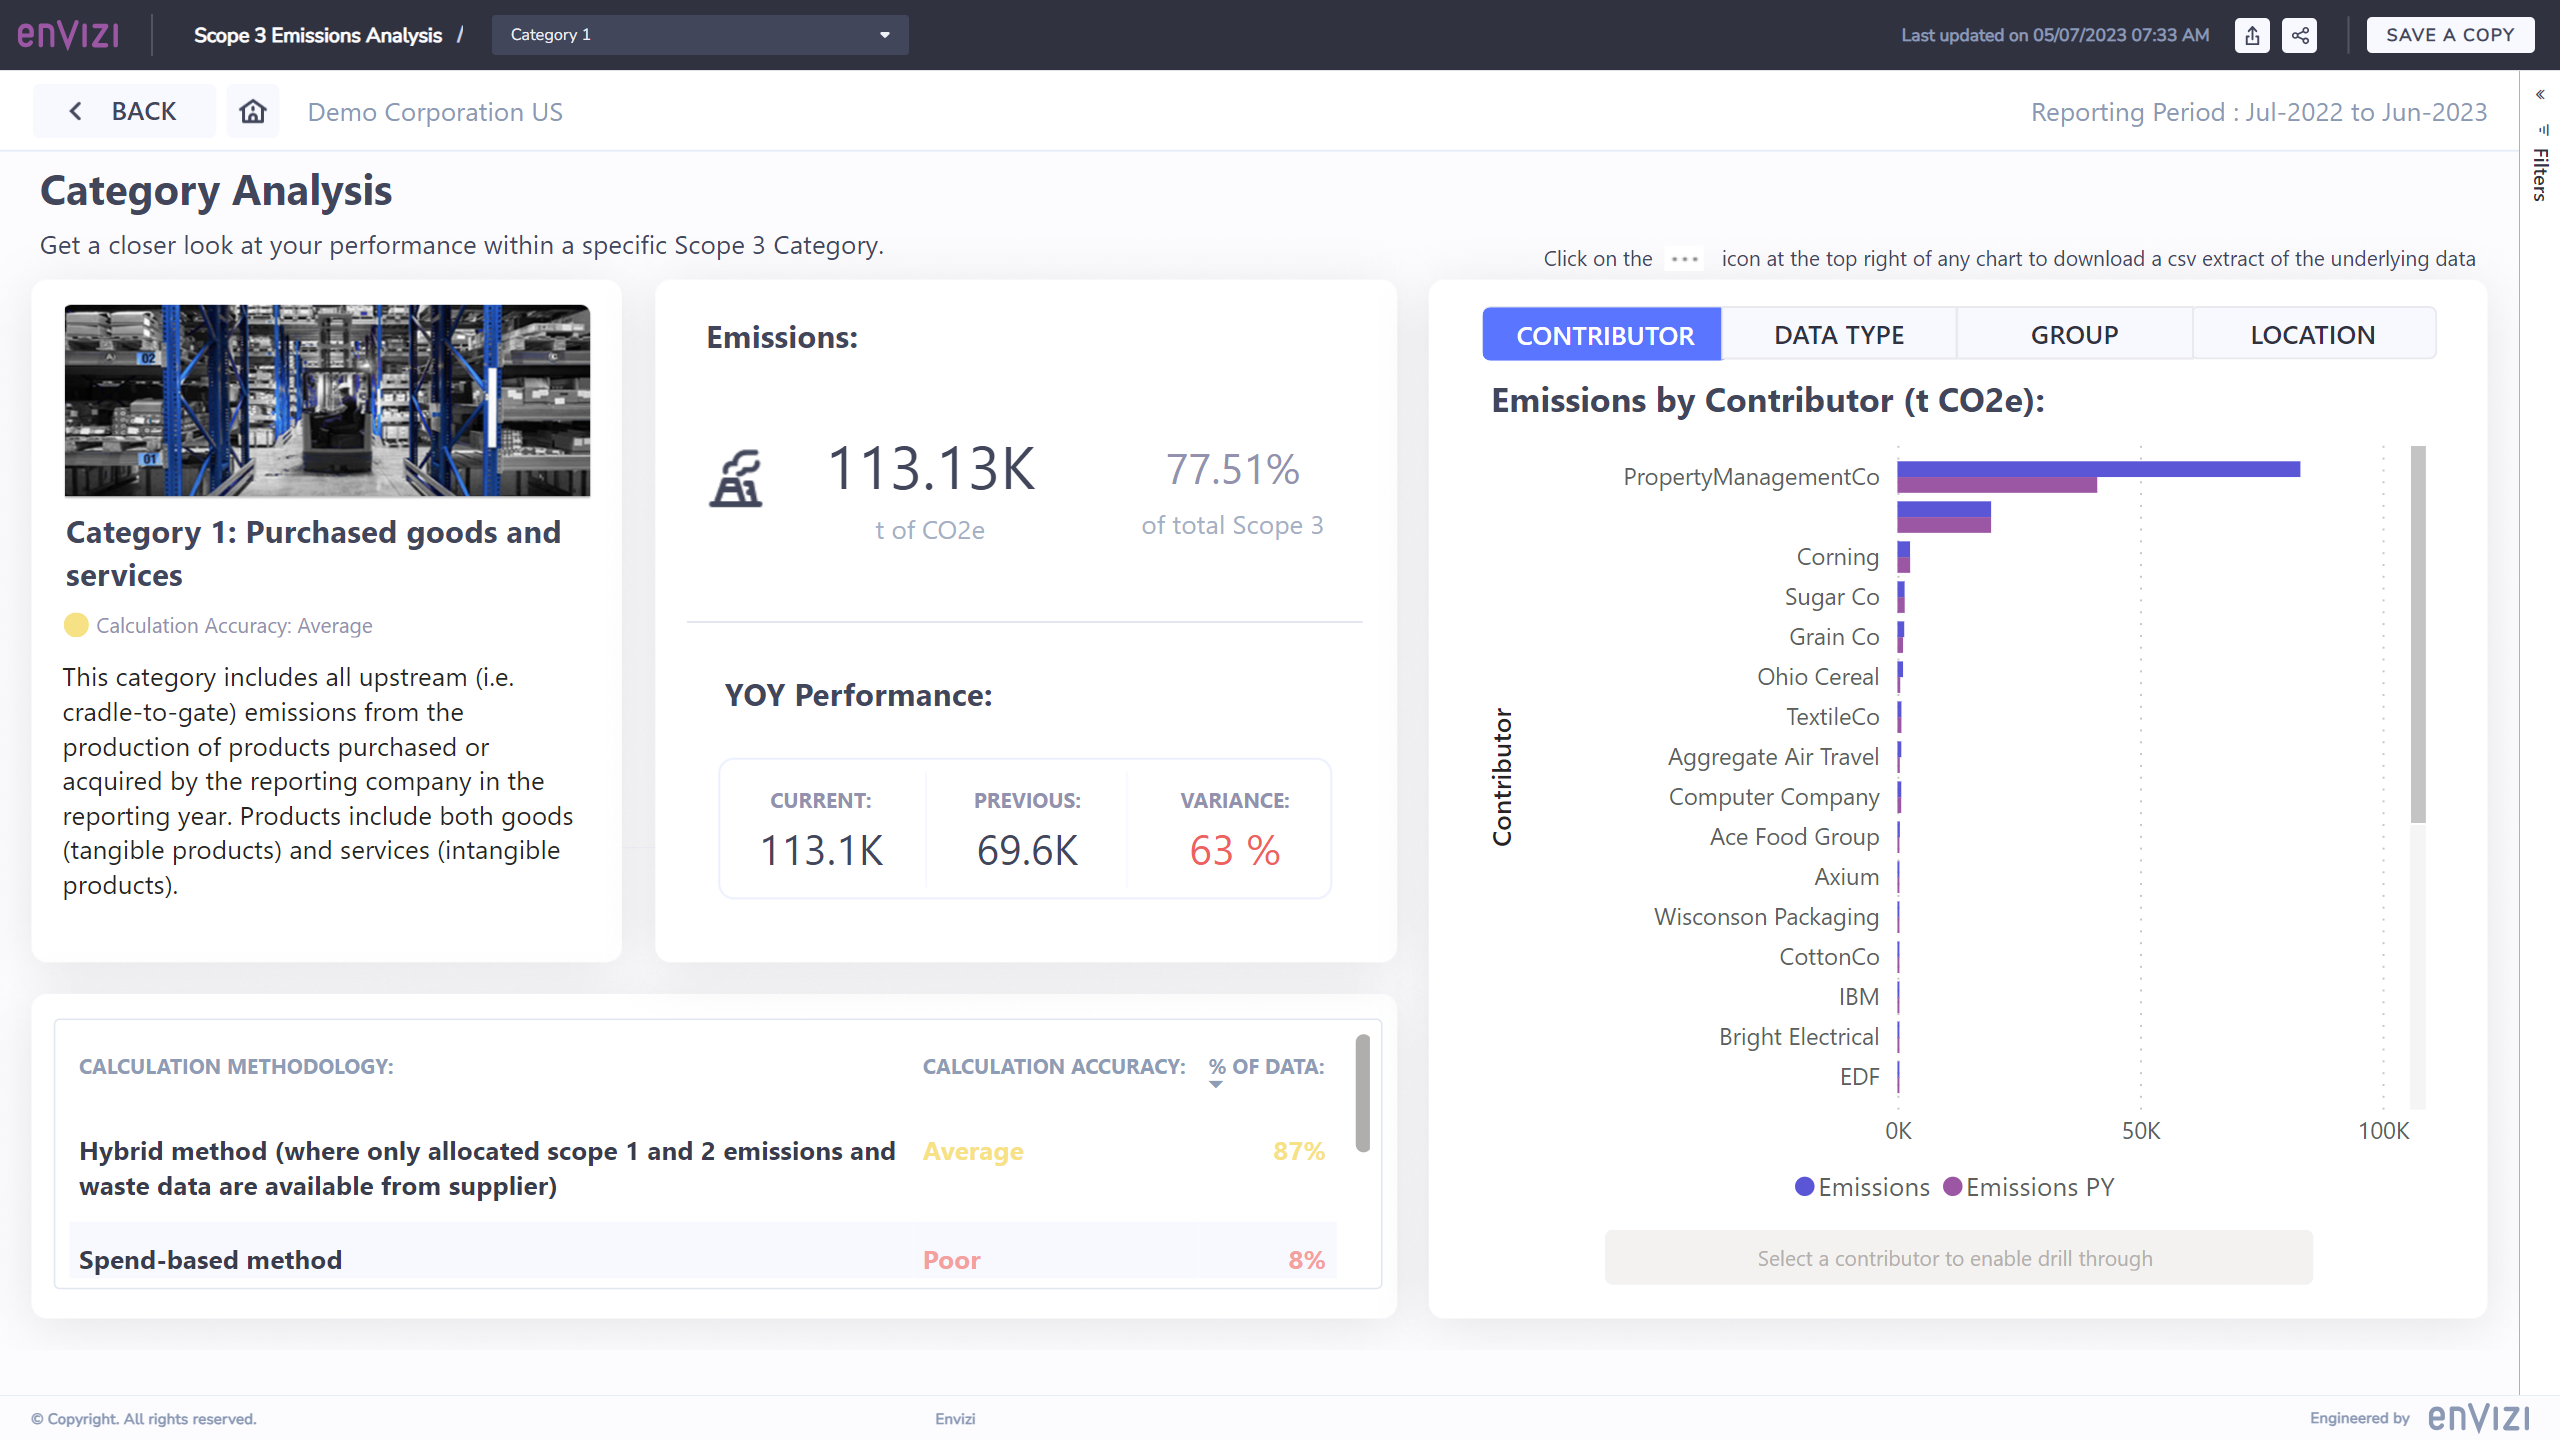
Category Description and Calculation Accuracy: The top left panel of this page offers a comprehensive description of the presented category along with an assessment of the calculation accuracy. It provides insights into the nature and scope of the category, enabling a clear understanding of the emissions under consideration. Additionally, the calculation accuracy evaluation ensures transparency and reliability in the data used for analysis.
Summary of Total Emissions: In the top middle panel, you will find a concise summary of the total emissions attributed to the selected category. It includes the percentage of these emissions relative to the overall scope 3 emissions. Furthermore, a year-on-year comparison and variance analysis are provided, allowing you to assess trends and changes in emissions over time.
Calculation Methods in Use: The bottom left panel displays a list of the calculation methods employed for the selected category. It also indicates the percentage of data to which each method applies. This information helps you understand the data collection and calculation procedures utilized for specific aspects within the category, promoting transparency and insight into the accuracy of the reported emissions.
Detailed Emissions Analysis: The right-hand panel offers a comprehensive and detailed analysis of the emissions within the selected category. Here, you can toggle between various perspectives such as contributor, data type, group, and location to explore the emissions data from different angles. Each graph contains drill-through values that can be accessed by hovering over the graph and selecting the corresponding drill-down icons at the top. This functionality allows you to delve deeper into the data, gaining a more granular understanding of the emissions and identifying specific areas of interest or concern. Moreover, from the contributor perspective, you can conveniently select a contributor and navigate directly to the contributor analysis page for further examination and insights.
Category 3 Analysis Page
The category analysis page for Category 3 offers a unique perspective compared to other pages in the report.
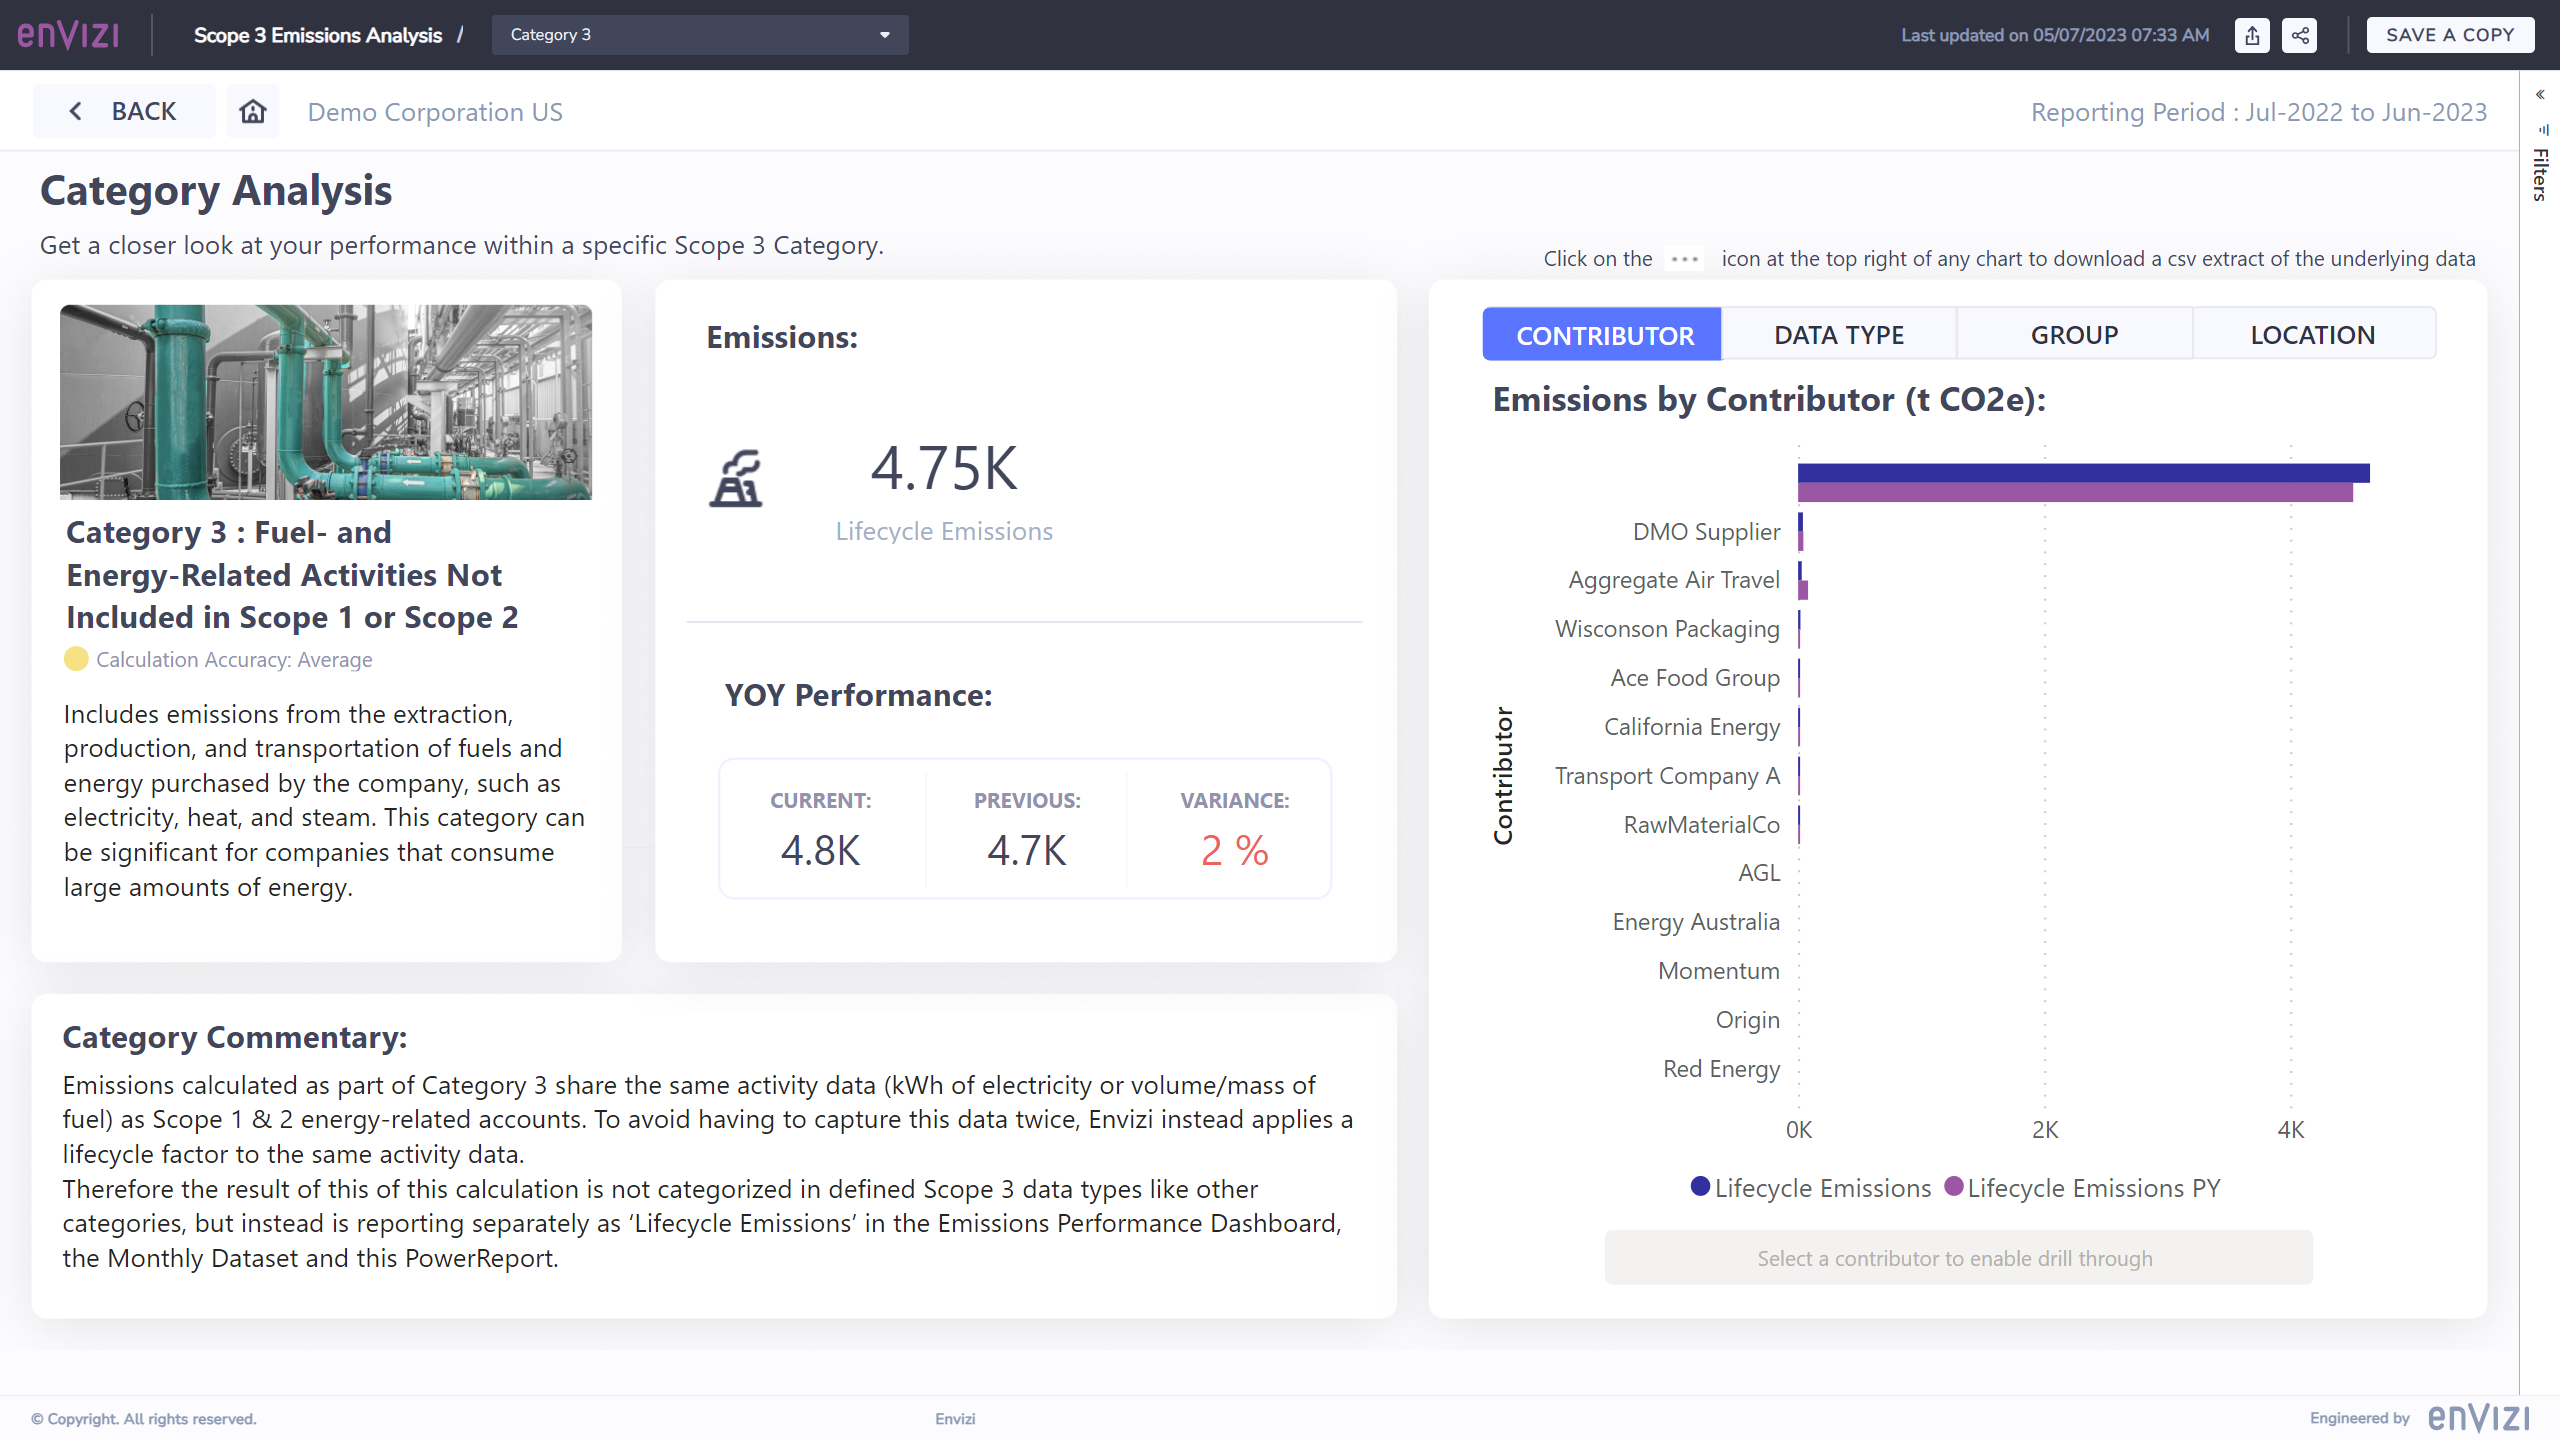
Scope 1 and 2 Indirect Lifecycle Emissions: This page provides you with a dedicated view of the scope 1 and 2 indirect lifecycle emissions that are included as part of scope 3 emissions. This distinction allows you to understand the specific contributions and impact of scope 1 and 2 activities on the overall scope 3 emissions within this category.
Calculation of Category 3 emissions: This value is the sum of the indirect lifecycle emissions from Scope 1 and 2 account styles and any additional emissions captured in Scope 3 account styles classified as ‘Category 3’. Note that this figure excludes all indirect lifecycle emissions from other Scope 3 account styles.
Remaining Elements: Apart from the percentage of total and method information, all other elements and features on this page remain consistent with the rest of the report. This ensures a familiar and seamless experience as you navigate through the analysis of Category 3 emissions.
Lifecycle emissions
Lifecycle emissions are defined as the complete emissions profile of an activity which includes the direct component (eg. burning of fuels or consumption of electricity) as well as the indirect component, which includes upstream and downstream emissions. For example, in the case of electricity consumption there are emissions associated with transmission and distribution losses. Likewise with Scope 1 fuels there are emissions associated with the extraction, processing, manufacture and delivery of the fuel. These losses are represented in the ‘Scope 3 Indirect’ column.
Indirect emissions are technically classified as Scope 3, but they differ from other Scope 3 sources because they result from activities that also produce Scope 1 and 2 emissions. To avoid duplicating account data and to show the link between the direct and indirect emissions, these indirect Scope 3 emissions have been included as a column in the grid rather than additional rows.
To determine total Scope 3 emissions for your organization simply sum the values in the ‘Emissions’ column for Scope 3 with the total values in the ‘Scope 3 Indirect’ column.
Further Details: For more in-depth information on the Category 3 analysis page and its specific considerations, you can refer to the following knowledge base article about the Emissions Performance dashboard.