Location Summary Page
The Location Summary page provides flexible options to enable you to view relevant overview information and analysis about a location (site).
The Location Summary page is gadget driven (as per Envizi's home page). You can decide per location which gadgets you want to view.
The gadgets available to you will depend on the products your organization has purchased.
By default all gadgets available to you are ON. In order to change these settings click on Customize.
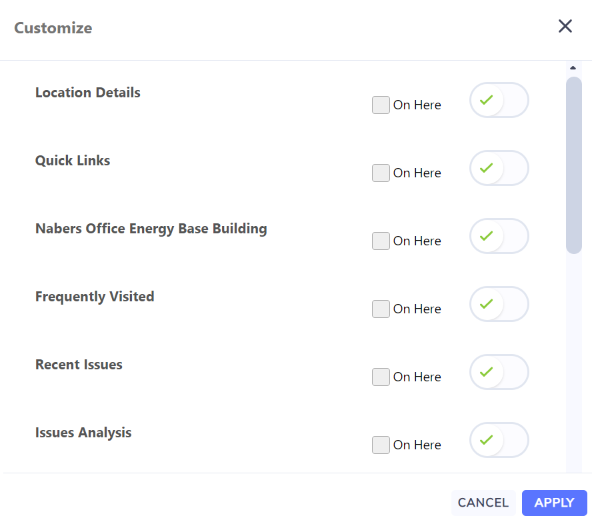
You can then turn a gadget ON or OFF for all Locations by toggling a gadget ON/OFF. If for most locations you want a gadget ON then toggle it to ON and then tick Off Here on locations where that gadget is not relevant to you. If for most locations you want a gadget OFF then toggle it to OFF and then tick On Here on locations where that gadget is relevant to you.
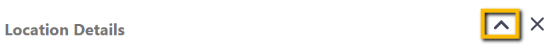
You can also turn OFF a gadget for the location you are viewing by clicking on the x on the top right hand side of any gadget.

You can collapse/restore a gadget for the location you are viewing by clicking the arrow on the top right hand side of any gadget.
Gadgets
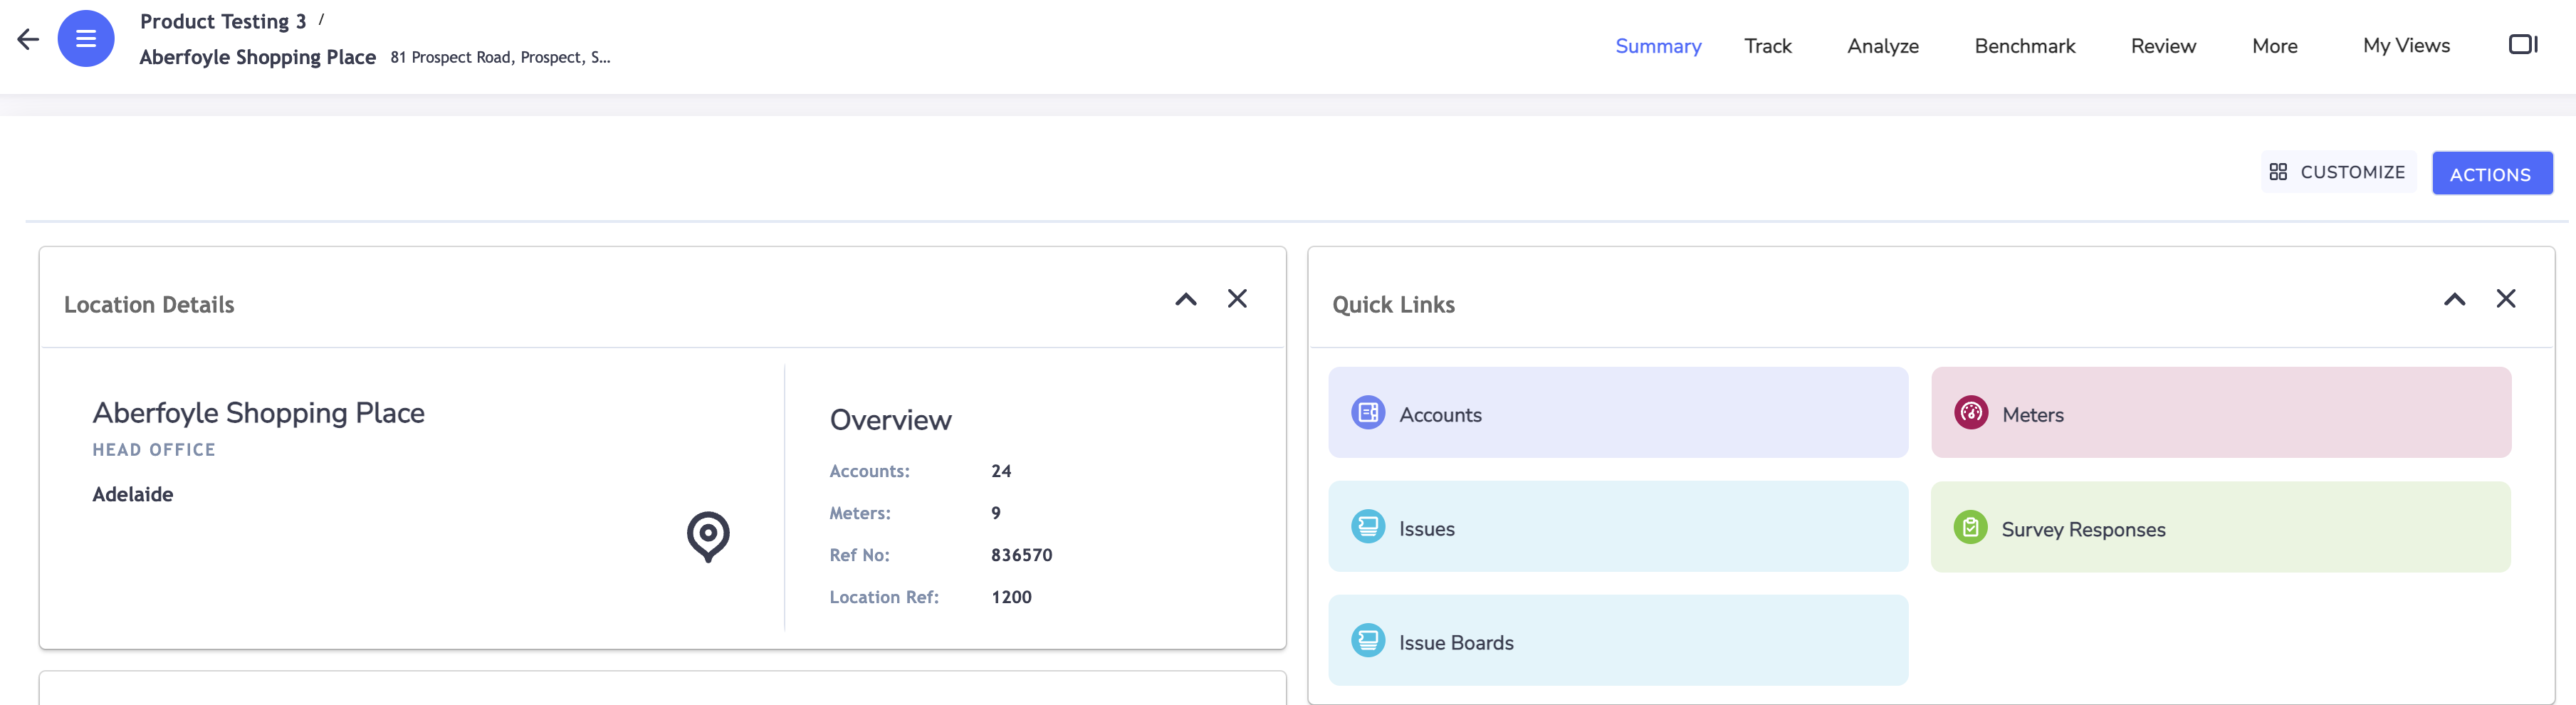
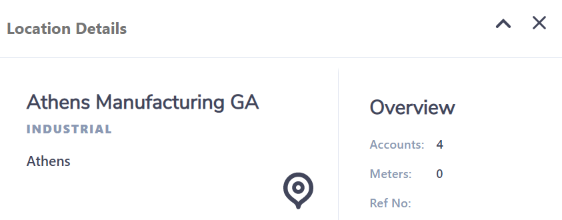
Location Details
This provides you with identifying and summary information about the location.
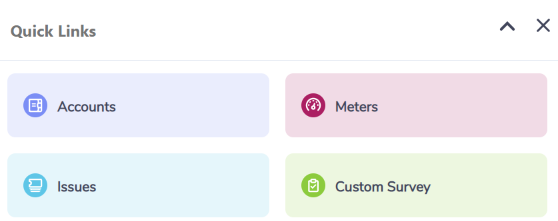
Quick Links
You can quickly navigate to a list of accounts, meters (if your organization has purchased Interval Meter Monitoring Overview, Building Energy Optimization, Equipment Fault Detection or Asset Performance Monitoring Overview) and Issues (if your organization has purchased Building Energy Performance Analytics, Equipment Fault Detection or Asset Performance Monitoring Overview) at this location.
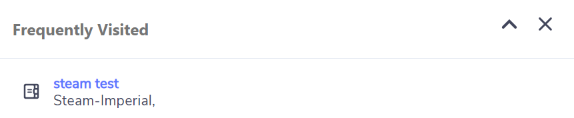
Recently Visited
You can quickly navigate to accounts and meters you frequently visit at the location.
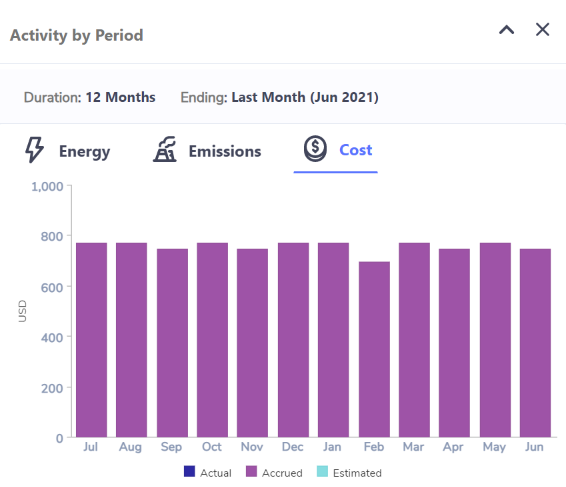
Activity by Period
This gadget is useful for you if you are interested in high level performance information.
You can see Energy consumption per month broken down by actual, accrued and estimated.
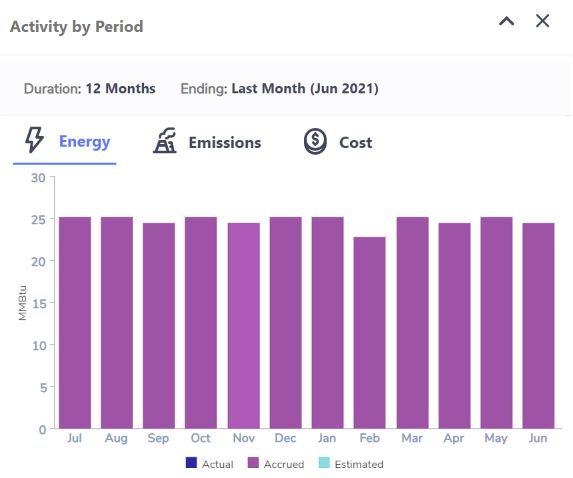
if your organization has purchased Sustainability Dashboards and Features then you will have a tab to view Emissions by month broken down actual, accrued and estimated.
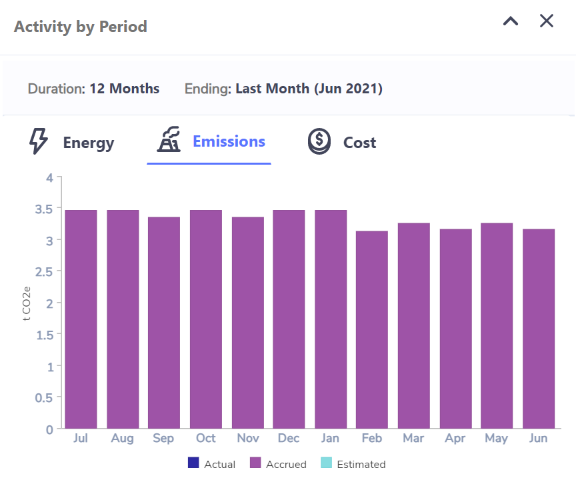
You can also see the Cost captured for all any accounts per month broken down by actual, accrued and estimated.
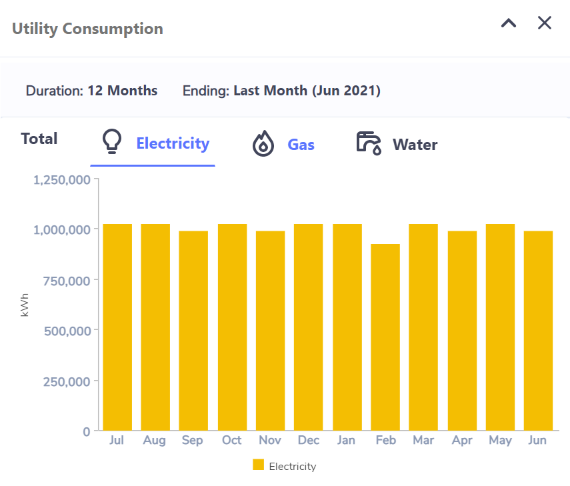
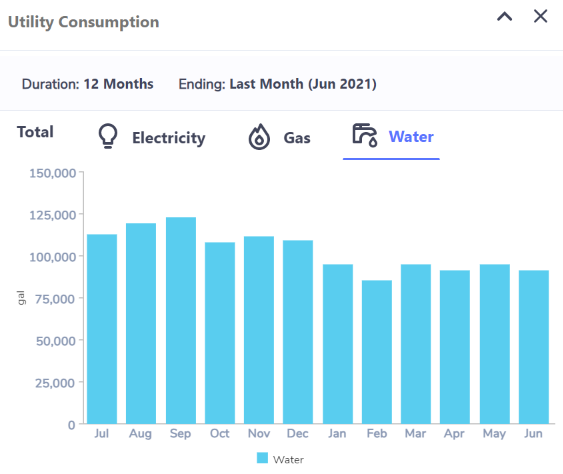
Utility Consumption
This gadget is useful for you if you are interested in high level performance information about your utilities.
You can see total consumption for Electricity, Natural Gas and Water for the period.
The unit of measure for each utility can be set by your system administrator in Reporting and Dashboard Preferences.

If the location you are viewing has accounts/meters (open or closed) for Electricity then you can click on the Electricity tab to see electricity consumption by month.
If the location you are viewing has accounts/meters (open or closed) for Electricity then you can click on the Gas tab to see natural consumption by month.
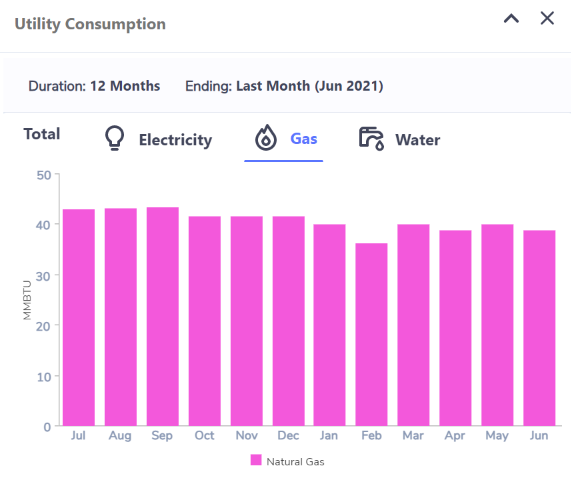
If the location you are viewing has accounts/meters (open or closed) for Electricity then you can click on the Water tab to see water consumption by month.
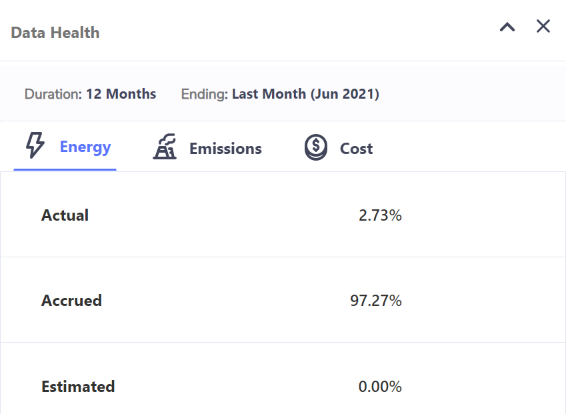
Data Health
This gadget is useful for you if you are interested in high level performance information and you need to understand how much your data is actual and how much is calculated by the system as accrued.
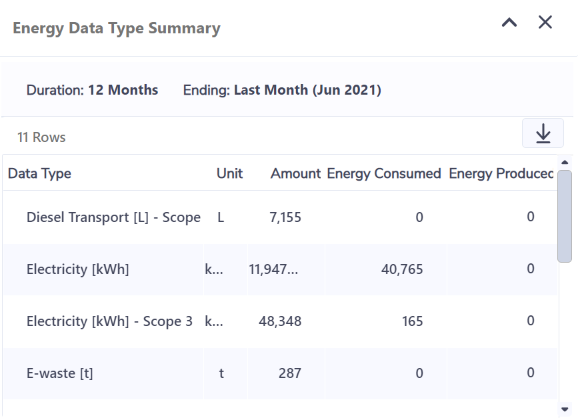
Energy Data Type Summary
This gadget is useful for you if you are interested in high level performance information across all data types.
You can view the Energy conversion per data type.
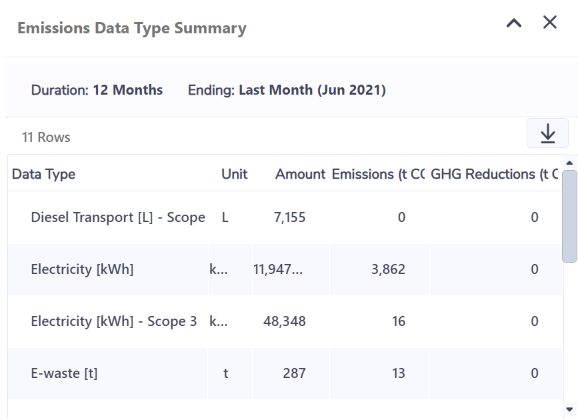
Emissions Data Type Summary
This gadget is useful for you if you are interested in high level performance information across all data types.
if your organization has purchased Sustainability Dashboards and Features then you will be able to view Emissions per data type.
Cost Data Type Summary
This gadget is useful for you if you are interested in high level performance information across all data types.
You can view the cost captured per data type.
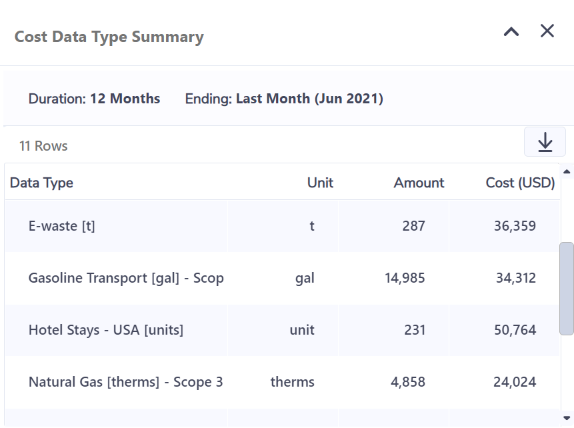
All the gadgets on the Location summary page use live data, not daily refreshed data.
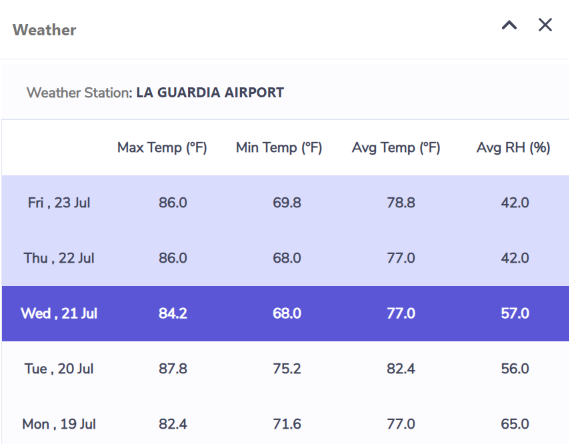
Weather
This gadget is useful for you if you are interested in key performance measures at your location that are impacted by weather.
If your organization has purchased Interval Meter Monitoring Overview or Utility Data Management + Analytics Overview Overview then you will be able to view weather for the location.
You can see the source weather station for the location and forecast weather data in yellow, today's forecast weather in blue observed weather for past days in grey, and future weather in lighter blue.
Meter Profiles
This gadget is useful for you if you are interested in analyzing detailed interval data in order to optimally manage your energy and equipment.
If your organization has purchased Interval Meter Monitoring Overview and in your role you are interested in granular meter performance, it would be useful for you to have a preview of the last performance of key Meters at the Location.
When you first view a Location you are likely to see this message in the gadget if you have not set any favorite Meters.
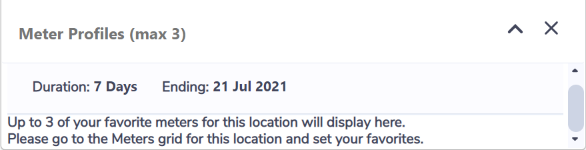
As the the instruction. you should go to the Meters grid (More > Meters) and set up to 3 meters as your favorites to view in the summary page. These meters are ones you check regularly and may want to investigate further of the preview of them on the location summary page flags something for you.
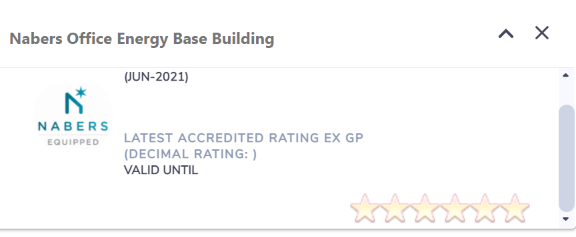
NABERS
This gadget is useful for you if you are interested in improving or retaining your Location's NABERS rating.
If your organization has purchased NABERS, then you will be able to see your latest NABERS Office Energy Base Building information for the Location.
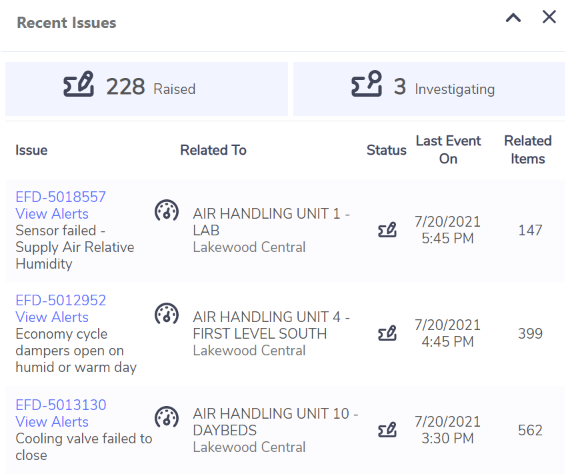
Recent Issues
This gadget is useful for you if you are interested in resolving building, asset or equipment issues that would save you money.
This gadget is available if your organization has purchased Building Energy Performance Analytics, Equipment Fault Detection or Asset Performance Monitoring Overview.
In this gadget you can see up to 5 issues that have most recently been updated with a related items (alert).
You can click on the issue number to see more information about the issue.
The Last Event On column shows you when the last alert was triggered for the issue.
The Related Items column shows you the number of related items (alerts) triggered for the same issue. If the issue is related to Building Energy Performance Analytics then the potential cost savings for resolving the issue will display below the number.
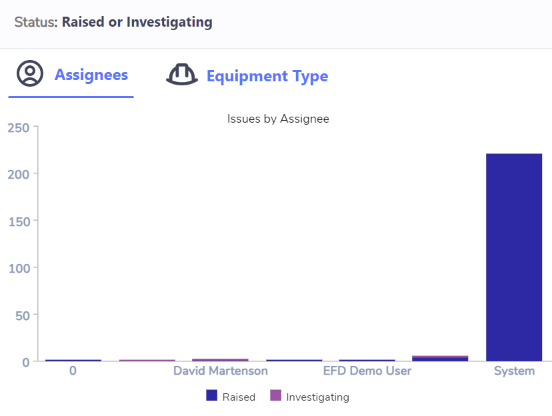
Issues Analysis
This gadget is useful for you if you are interested in resolving building, asset or equipment issues that would save you money.
This gadget is available if your organization has purchased Building Energy Performance Analytics, Equipment Fault Detection or Asset Performance Monitoring Overview.
The first tab will show you a breakdown of issues by assignee.
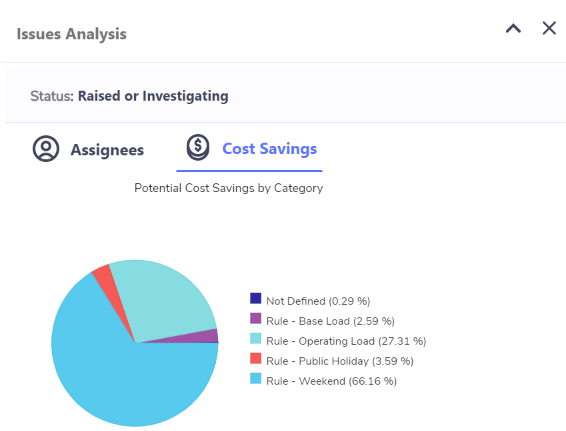
If the location you are viewing is set to use Building Energy Performance Analytics, then you will see a tab showing you a pie chart of your potential cost savings by category of issue.
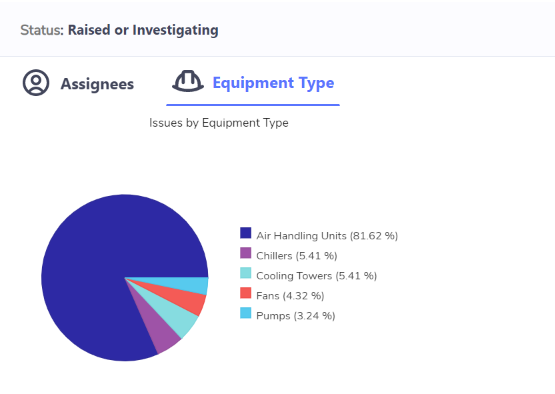
If the location you are viewing is set to use Equipment Fault Detection, then you will see a tab showing you a pie chart of the proportion of issues by equipment type.
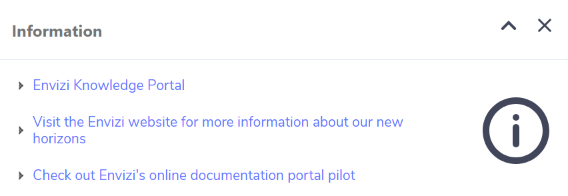
If your organization has requested Information Links (which has customized links to external URLs), you will be able to turn ON this gadget too.