
Interval Meter Monitoring Overview
Summary
The Interval Meter Monitoring (IMM) module is Envizi's entry level meter data vizualisation and reporting tool. It is part of Envizi's Energy Management solution. The module's purpose is to consolidate interval meter data from utility meter providers and sub-metering systems, to simplify and standardize monitoring of electricity, gas and water use at a granular level.
Benefits
Access standard, granular data from dispersed meters.
Avoid manual data capture.
Consolidate data from multiple providers (electricity, gas and water) and hardware devices (BMS, gateway devices) in a single platform.
A complete, accurate, granular data set that can be leveraged for further analysis.
Navigating to a Meter
Search Bar
The search bar feature in the user interface can be used to search for a meter. Select the Meters search category in the drop down. Then type a search query for the meter. The search results will match on any of the following search criteria:
Location Name
Meter Name
Serial No (meter ID)
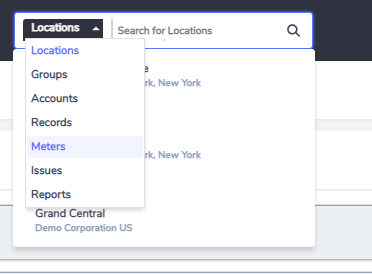
The more specific your search query, the more specific your results will be. For example, you can search on a location name, however the result will return all meters at that location. If you search for a specific Serial No (e.g. NGX002347), the system will return an exact match. Once a meter is selected, you will then be taken to the Meter Summary page for that meter. If more than 10 items match you search criteria you will have the option to view all results in a grid and you can then select the meter you are interested in.
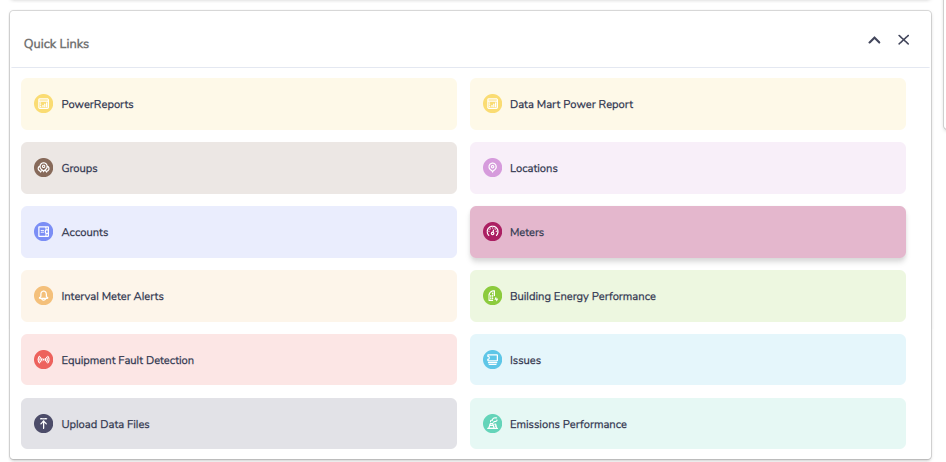
Home Page Meter Quick Link
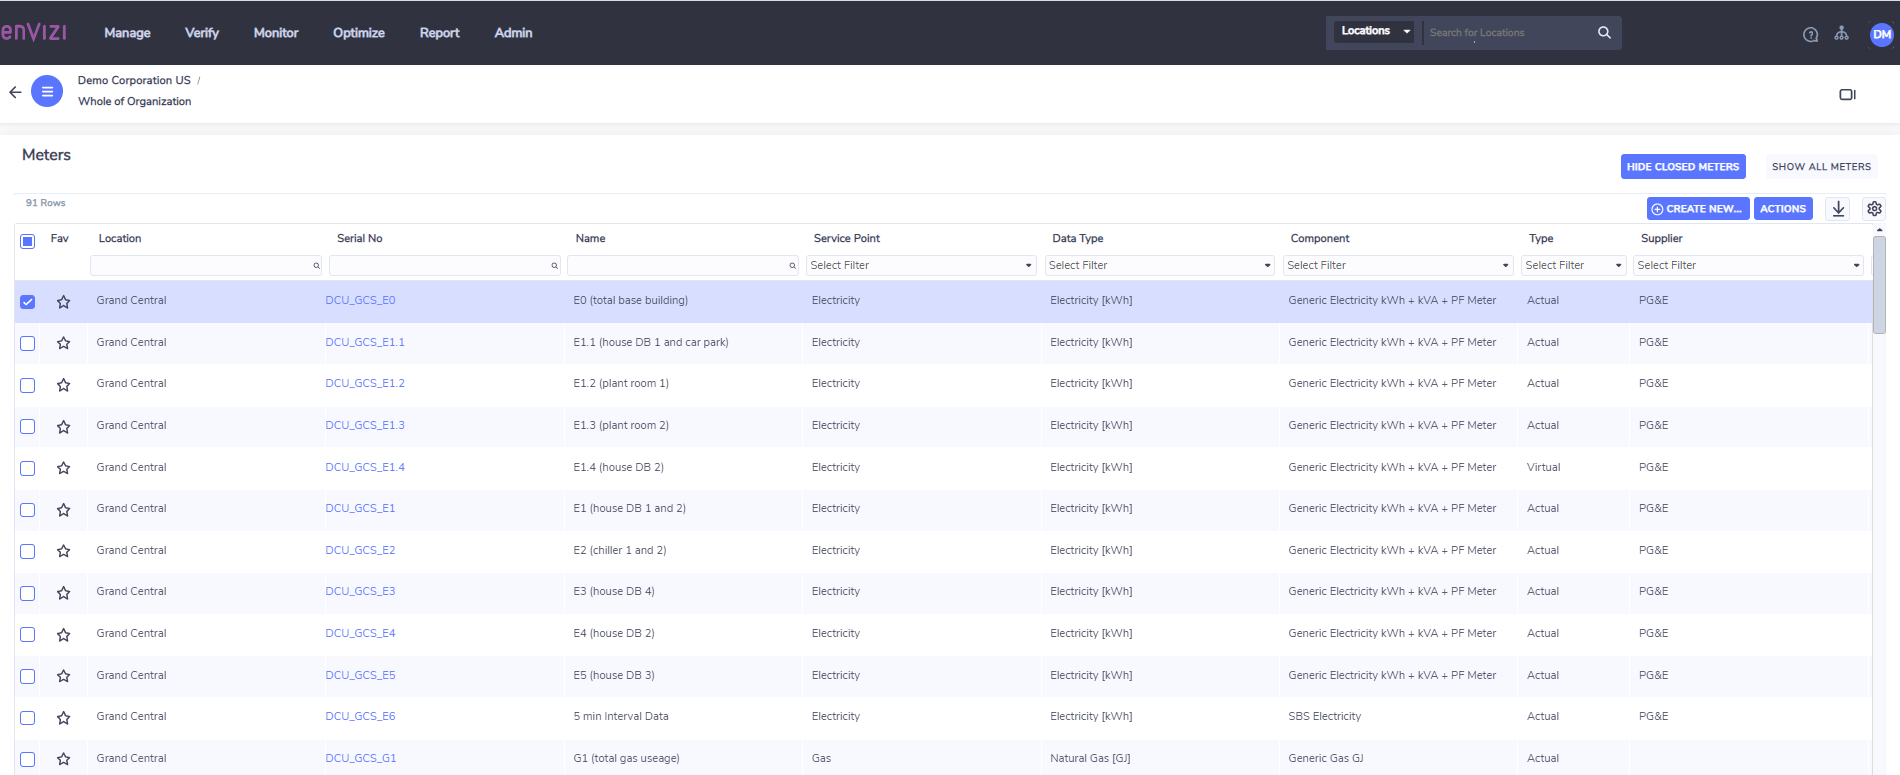
The Meters Quick Link on the Home Page can be used to navigate to a meter. If you click on the Meters Quick Link, you will be taken to the Meters page. This is a list of all meters relevant to your access level. For example, if you only have location level access, only meters from that location will be displayed. If you have organization level access, the list will contain all meters across all locations. From the meters page you can use the filtering and search features within the table of meters. You can then navigate to a meter of interest by clicking on the hyperlink (on the Serial No column). Clicking on the hyperlink will take you to the Meter Summary page for that meter.
Explore your Organization via the Hierarchy
The Organization Hierarchy section can be used to navigate to the Meter Summary page of a given meter. First you must drill into the relevant group structure to first identify the location of interest, from here you can open the "All Meters" folder to expose the meter hierarchy. You may need to drill through the meter hierarchy depending on how the meters have been configured. Once the meter of interest has been identified, you can then click on the meter and you will be taken to the Meter Summary page.

Meters List
If you are at the location level, you can access Meters for that location from the More menu.
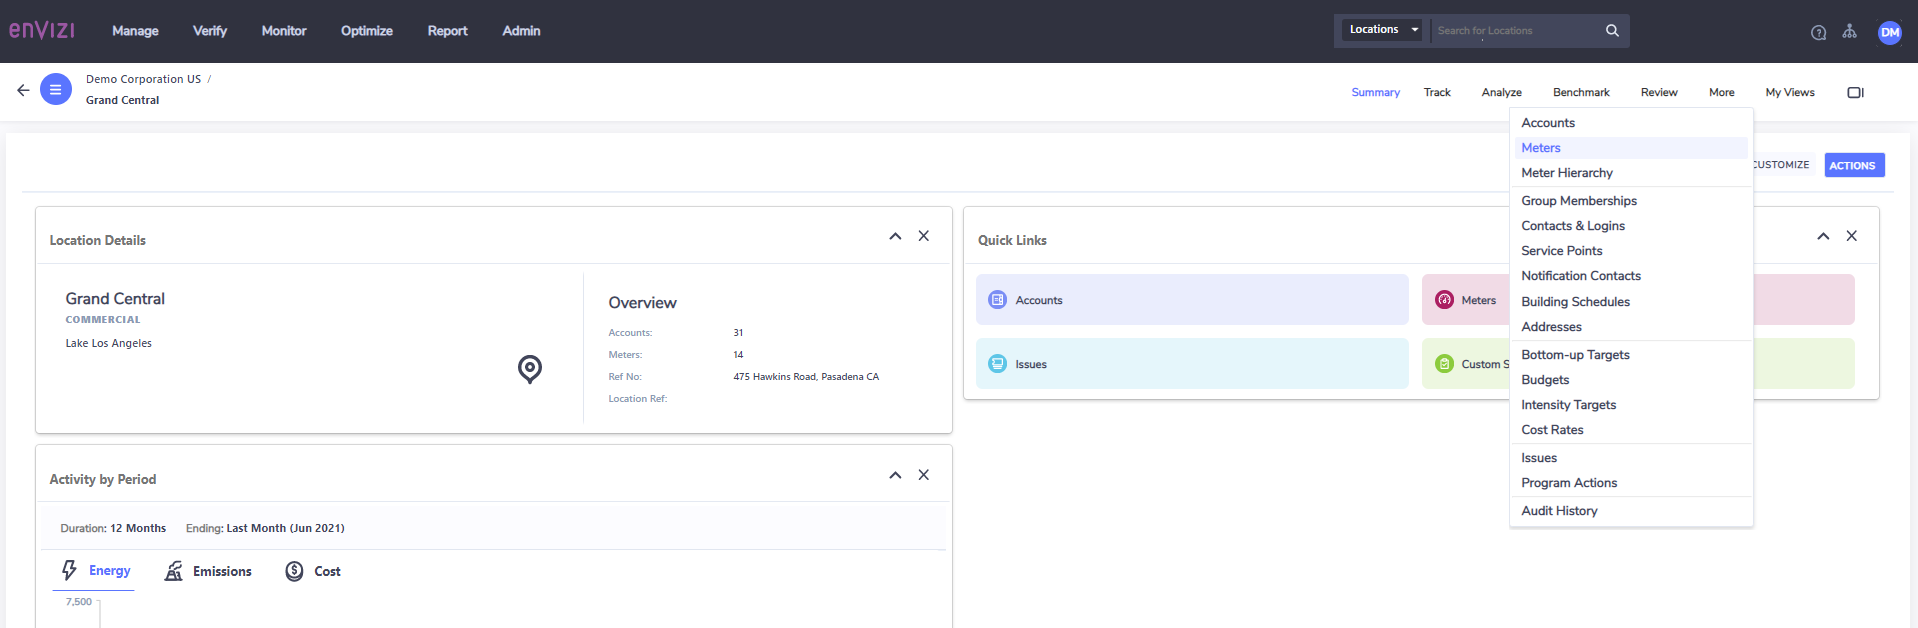

From the Meters menu you can use the right click option or Actions button on a given meter to perform a number of actions. This includes looking at data (Daily Data, Monthly Data), System Administrator functions (including Edit Meter, Delete Meter). You can also create/edit alerts (Absolute Rules, Variance Rules, Inactivity Rules).

Meter Hierarchy
If you are at the location level, you can access Meter Hierarchy for that location from the More menu. This will provide a graphical representation of the meter hierarchy configured at a given location.

The hierarchy displays the relationships between parent and child meters; it also shows a distinction between electricity, water, gas and virtual meters by displaying them as different colors:
Green - Electricity Meters
Blue - Water Meters
Red - Gas Meters
White - Virtual Meters
You can click on a meter contained within the hierarchy, after which you will be prompted to select More Info which will take you to the Meter Summary page.

Organization, Group and Location Level Meter Comparison
The Meter Comparison dashboard is available at the organization, group and location levels via the Analyze menu. The dashboard allows you to compare up to 20 items at the Organization, Group and Location levels.
Meter Level Functionality
The Meter Summary page is the first page that is loaded when you navigate to a meter. The Meter Summary page follows the same design and layout as other summary pages within Envizi (e.g Group, Location and Account).
The left hand panel provides you contextual information about the meter such as the meter name, serial number, related service point and component used. If an account has been linked to the meter, then the linked account will be displayed as a hyperlink.
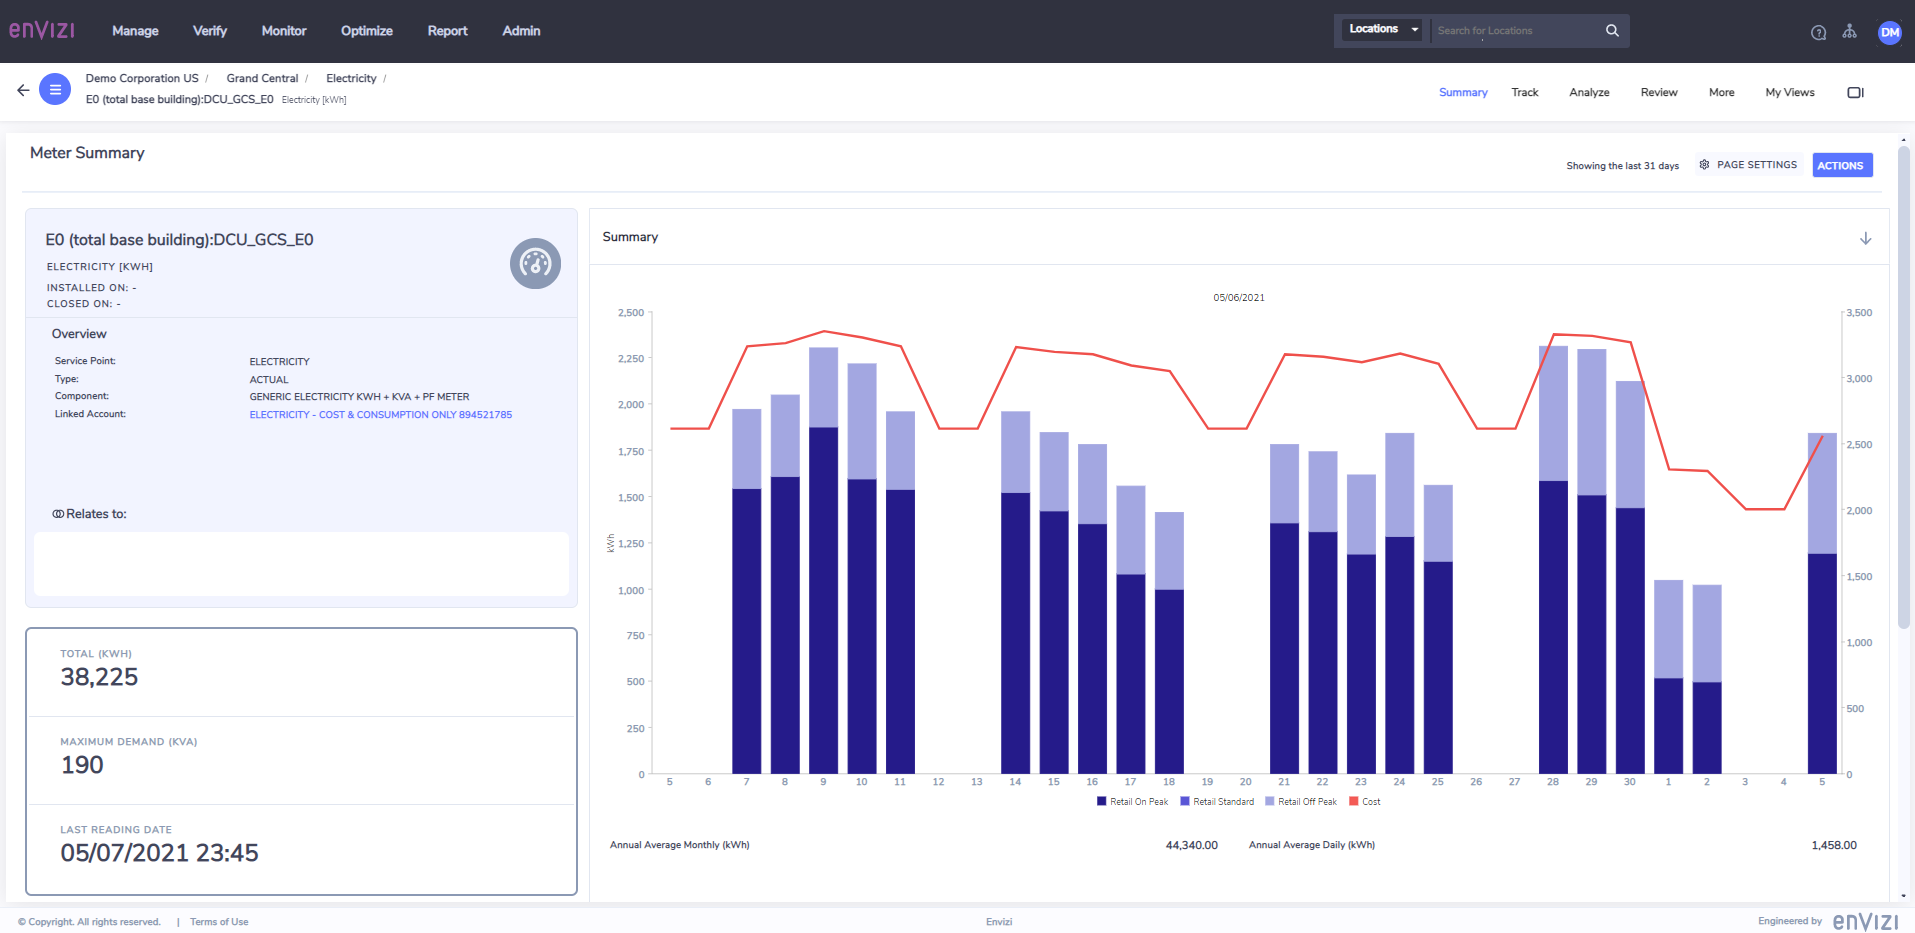
Summary information is presented in the summary panels in the body of the page. The time period defaults to 1 month (up to 31 days). The time period can be changed using the settings icon next to the action button. The middle two panels show Total (consumption) and Maximum Demand (highest demand recorded across the reported time period). The final panel on the right provides the Last Reading Date, showing the last date and time data was captured in the system.

The chart displays the daily consumption trend, broken down by time of use across the time period selected. The Time of Use bands are defined within the region setting applicable to the meter's location.
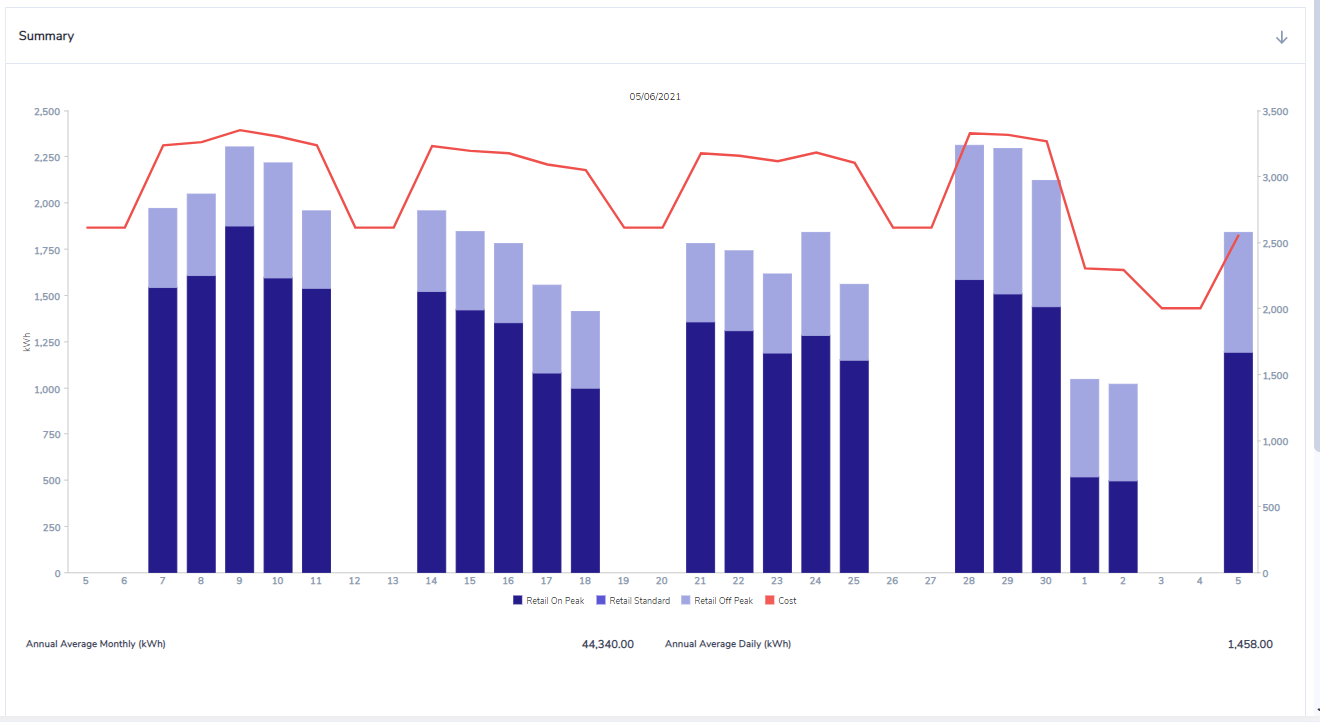
The grid displays a table view of daily summary information across the time period. This information can be downloaded via csv, html or xml.

Track Meter Performance
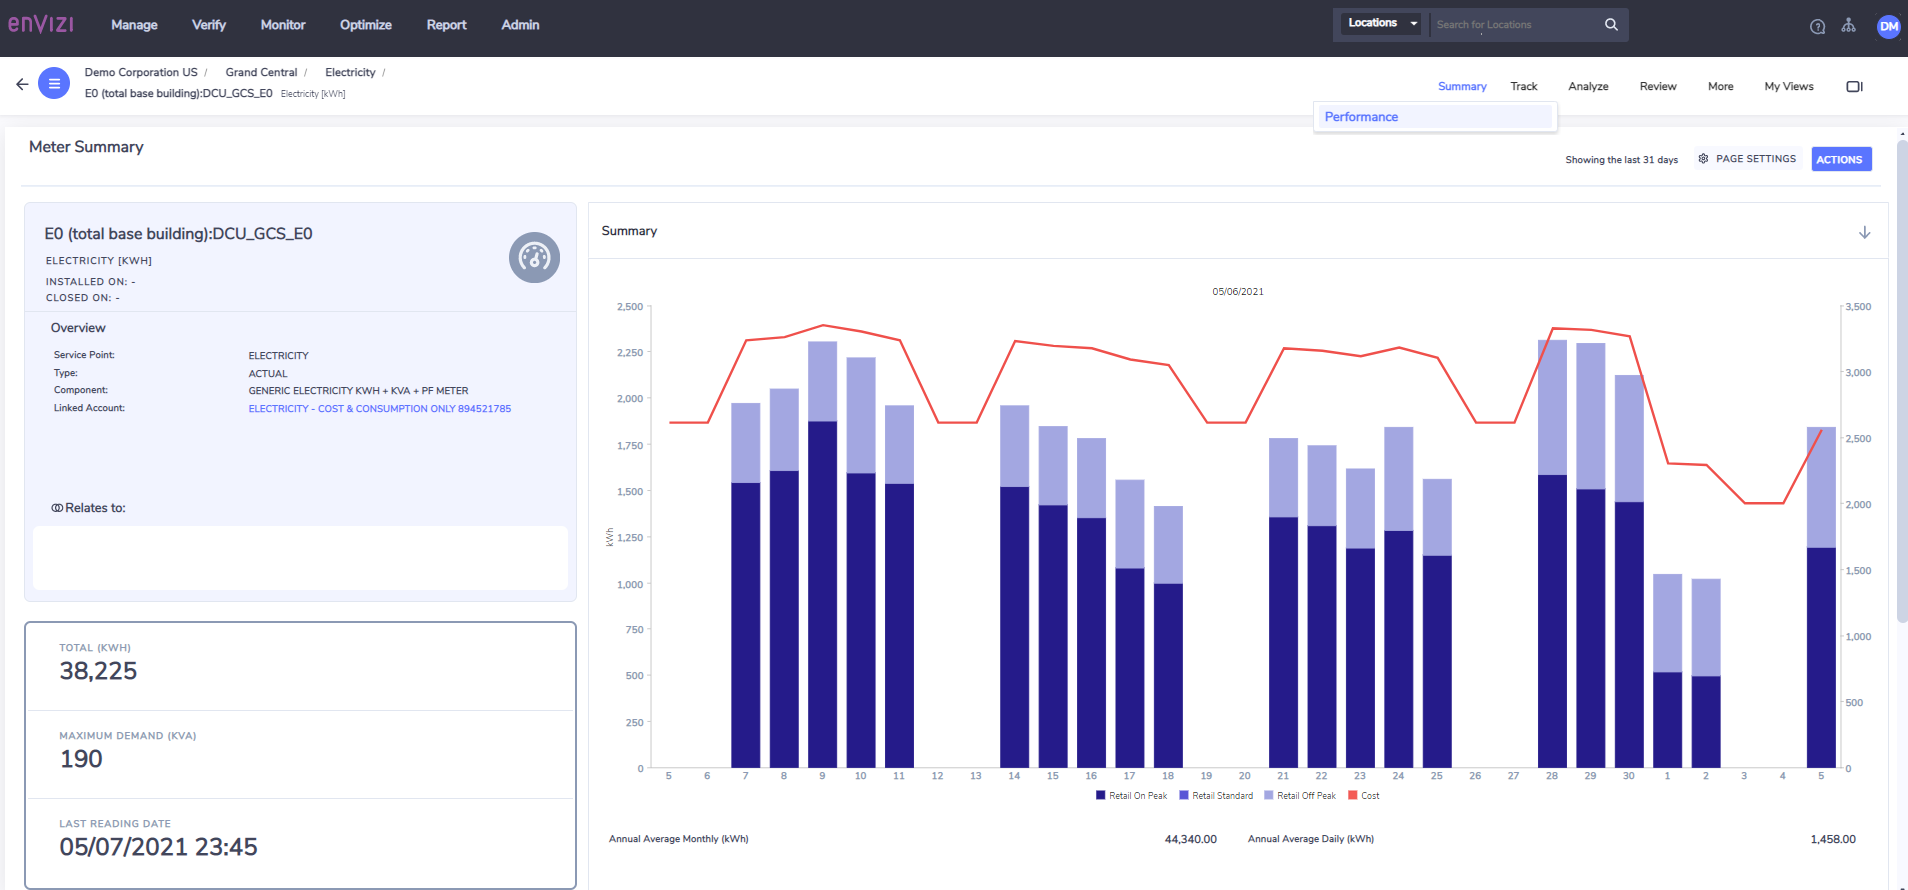
The Meter Performance dashboard allows you to track performance (based on meter data) on a monthly basis. You can select a Compare With period from the following options:
Previous Period
Same Period Previous Year
Rolling 12 month Average
Base Ending xxxx (where xxxx is the base year set for your organization)
Normalize
The Compare With period is displayed as the grey comparison bar in the main chart.

Analyze Interval Meter Data
The Analyze meter dashboards at the meter level visualize interval meter data.
Review Meter Data
The Review menu contains content related to interval meter data that can be extracted from the system.
Bulk Data Extract
Interval data for Electricity, Water and Gas utilites can be downloaded from Envizi is bulk, see here for more details.
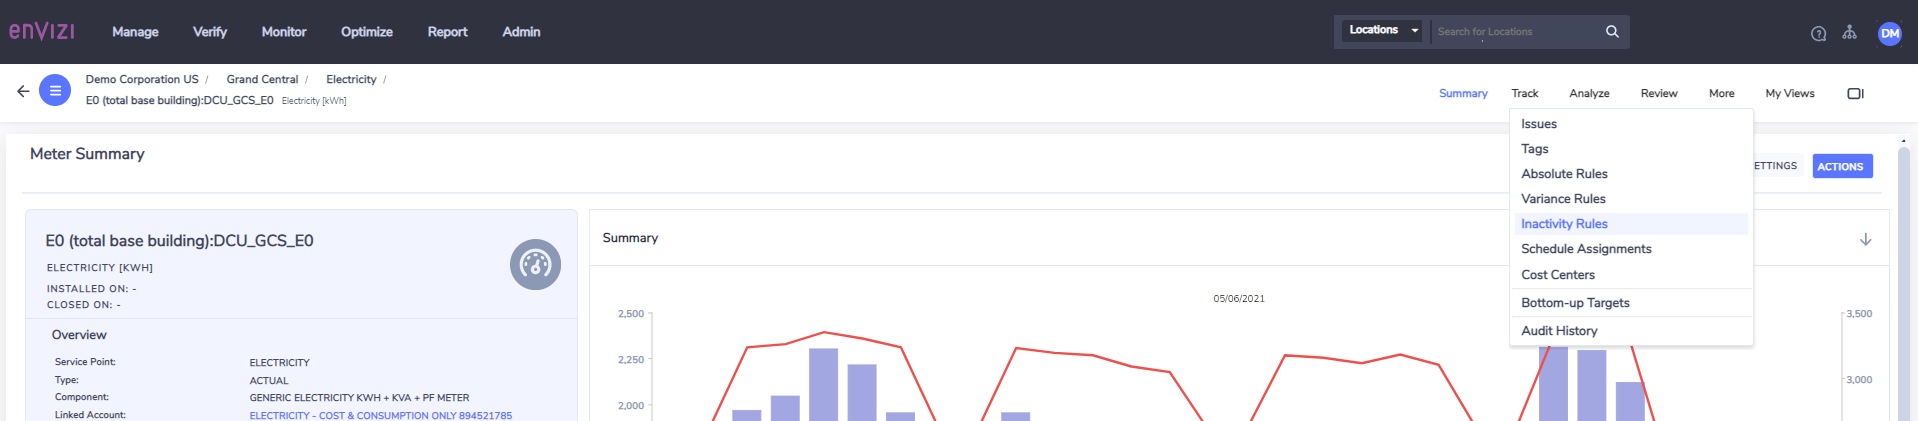
More Meter Options
Absolute Rules
Absolute rules can be set up to alert you when interval meter data meets the criteria that you specify so that you can take investigate the occurrence.
You can setup absolute alert rules from the Interval Meter Alert center or directly from Absolute Rules which can found in the meter More sub-menu

or from the actions in the meters grids

See Interval Meter Alerting for how to setup absolute rules.
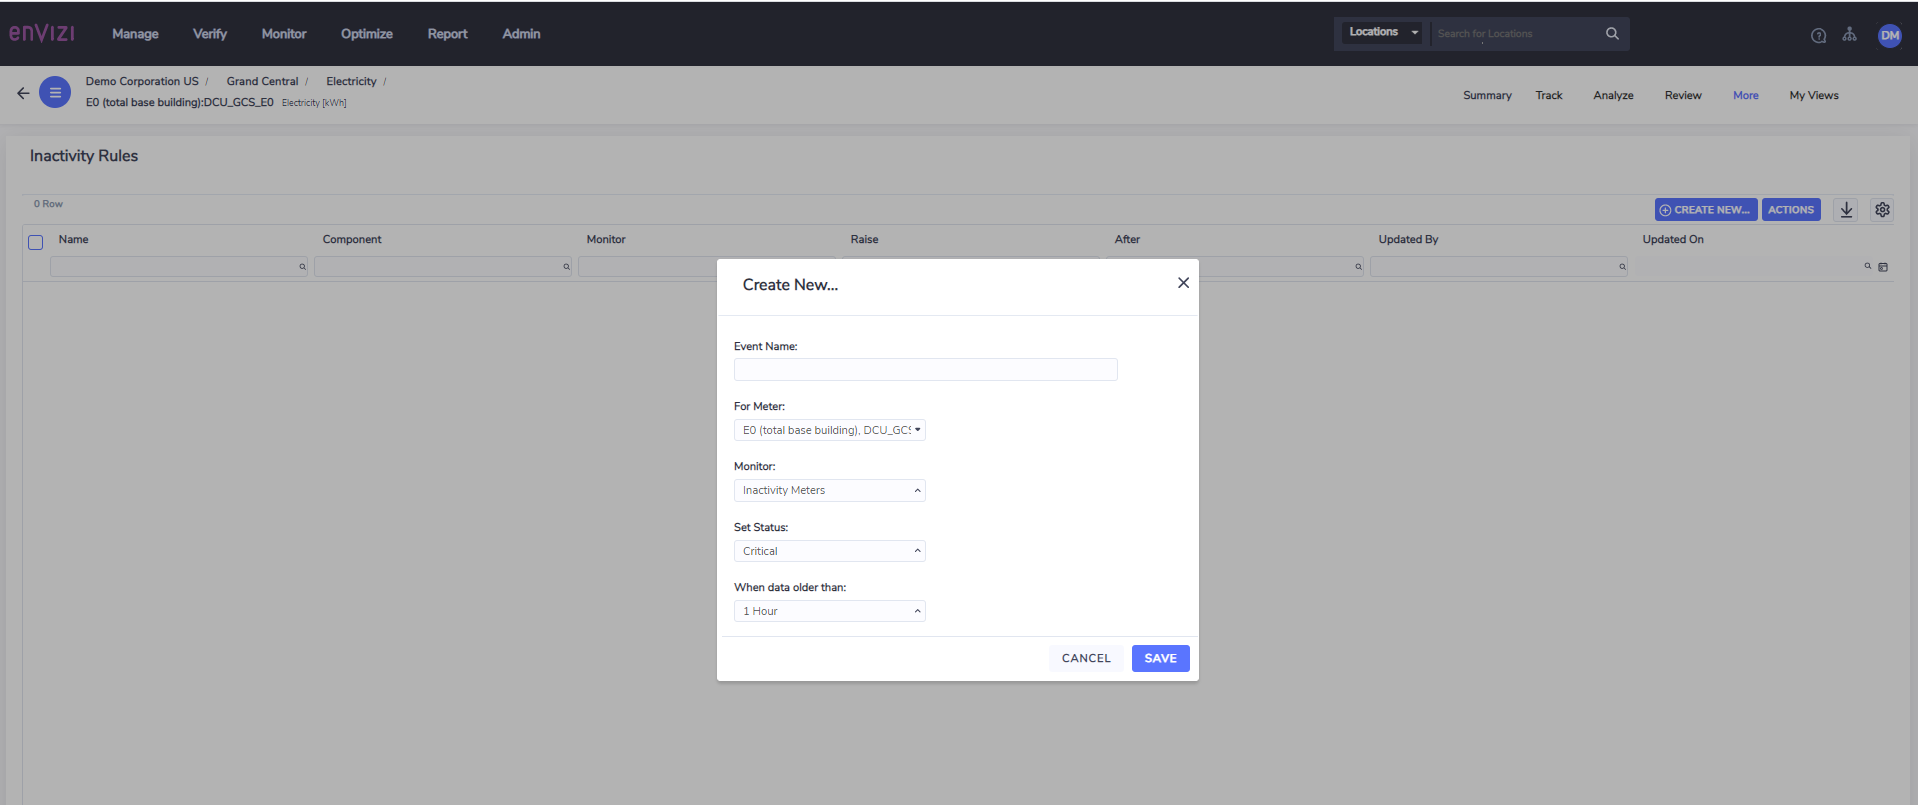
Inactivity Rules
Inactivity Rules allow you to configure a rule to alert you if data is not uploaded for a given meter within a user defined time period.
See Data Inactivity Rules Uses and Best Practices for common scenarios and best practices around how to configure these rules.
If the rule condition is met, the notification contact/s set for the location for the status of that rule will receive an email notification.
Tags
Tags allow a meter to be tagged with a defined classification (e.g. HVAC). Tags are also used to configure rules governing if the meter's data is rolled into location, group or organizational level reporting (i.e. Consolidation Rule).
