Interval Meter Alerting
Interval Meter Alerts Center
Interval meter alert rules can be managed across a group or portfolio of locations via the Interval Meter Alerts center.
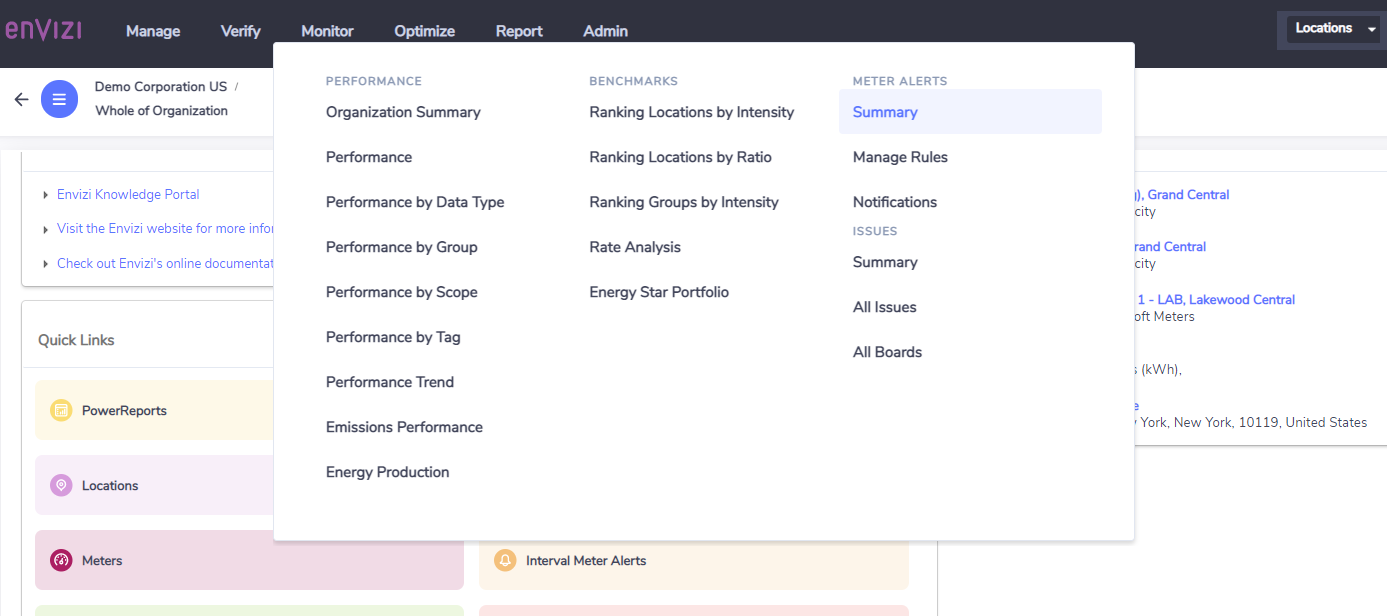
The Interval Meter Alerts center can be accessed via the Home page quick link:

or via the Monitor menu:
Tip: You can also set up alerts from the meter More menu or from the actions on the meters grid.
Interval Meter Alerts Summary Page
The Alert Rules and Notification Summary page is the first page that is loaded when you navigate to the Interval Meter Alerts center. The page follows the same design and layout as other summary pages within Envizi (e.g. Group, Location and Account).
The left hand of the page provides contextual information about the how many alert rules are set, broken down by data type. The numbers displayed appear to be hyperlinks, however they are not.

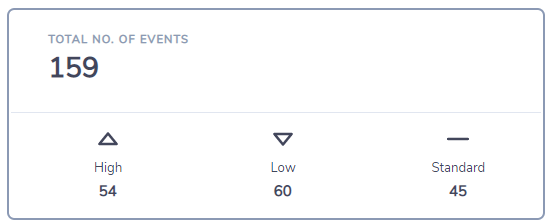
Summary information is presented in the Summary panels in the body of the page. The time period is fixed as the Last 30 Days; the other two panels show the total number of events and the number of events broken down by priority type (High, Standard and Low).
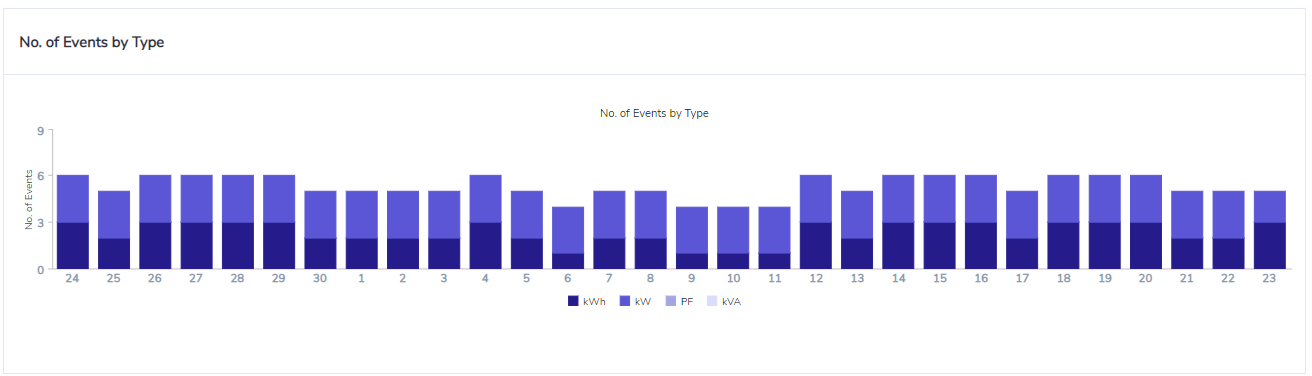
The stacked bar chart displays the alert trend by day over the last 30 days. The stacks represent the number of alerts for each relevant measure.
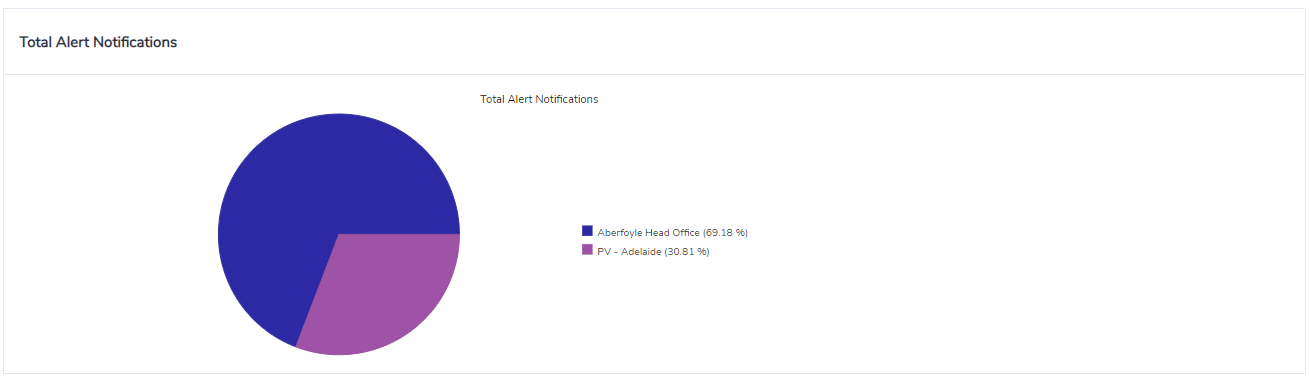
A pie chart shows the total number of events by location. The pie chart shows the top 10 locations. If more than 10 locations are included, then the remaining locations are aggregated into an item called "other".
The grid details the total number of events by location (it only shows locations that had events recorded in the last 30 days). A trend indication is included to provide an indication of whether alerts have increased or decreased over the last 30 days. The measures column provides a break down of alerts at a given location by measure (electricity only). The locations table provides an overview of the number of events by measure for each location that has recorded an event in the last 30 days. The break down of measures is represented as a pie chart in the right hand column. The middle column provides a trend indication for each location. An up arrow represents an increase in activity, a down arrow represents a decrease in activity.

Manage Rules
The Manage Rules menu is where you can create, edit or delete an alert rule. The following table is a step by step guide on how to set up or edit a rule for a given meter at a given location.
Step1
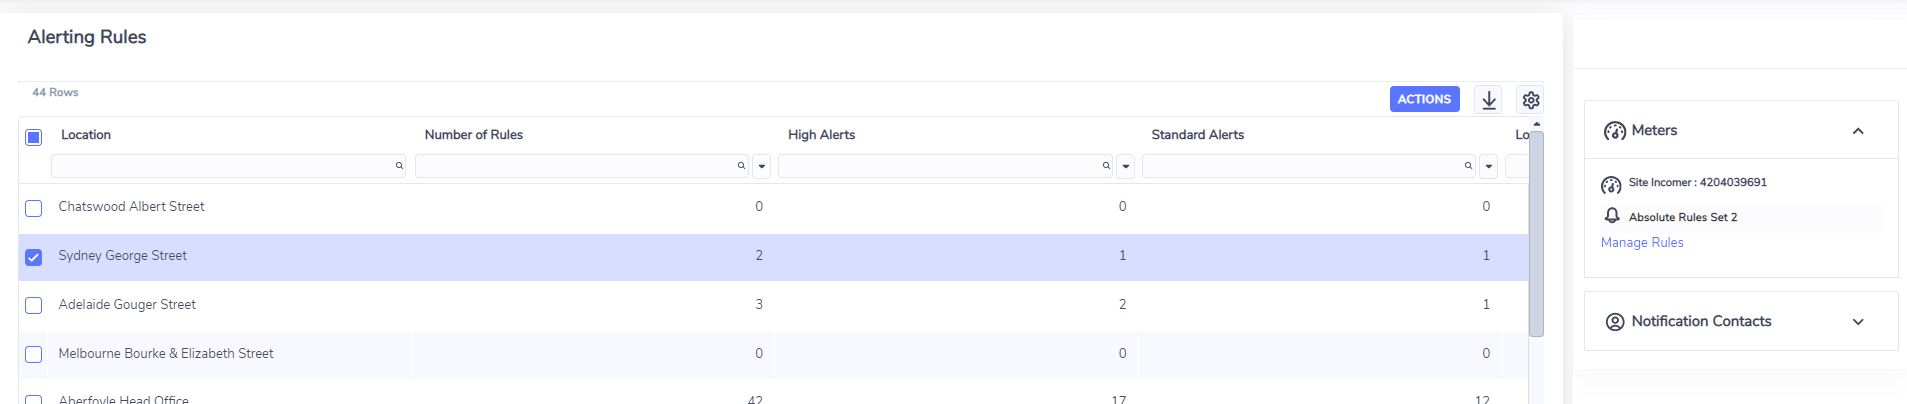
While in the Interval Meter Alerts, click on the Manage Rules menu in order to go to the Alerting Rules page.
In the table it will show you all locations that have at least one meter that has data recorded in the last 12 months
The table includes location name, number of rules created and a break down of alerts by priority

Step 2
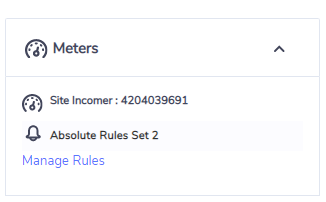
Once you have found the location of interest to you, expand the right hand preview panel to see the meters at the location (only meters that have data recorded within the last 12 months will show in the list of meters)
Step 3
Scroll through the list of maters to find the meter of interest
Select Manage Rules for the meter to set a Variance based alert
Step 4
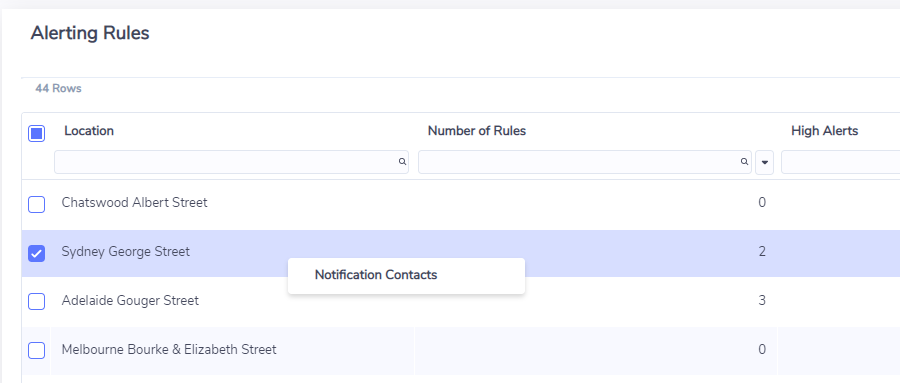
You can also manage who will be notified of an alert, by right clicking on the location you want to manage
Click on the Notification Contacts link, to be taken to the Notification Contacts page
Step 5
Follow the instructions on this page to configure notification contacts at a location.
Tip: You can also set up notification contacts from the location More menu or from the actions on the locations grid.
Absolute Rules
An Absolute Rule is one based on a user defined absolute threshold for consumption and demand measures. An absolute threshold is a set trigger point defined by the user, for example if demand exceeds 20 kW within a given time period.
Notifications
The Notifications menu provides information on how many alerts have been triggered for a given location and also provides information about the trend in notification activity over time. In addition to the Notifications tab, users can receive notifications via email (see section 6.2 Manage Rules). There will only be one notification raised per alert per data load. This means if data is loaded daily, the maximum number of alerts the system could generate is one per alert rule per meter.
Data displayed in the Notifications - Locations Overview dashboard is based on the time horizon selected in the time navigator
The grid shows each location where an alert has been triggered within the time period selected in the time navigator
Each location is displayed in a separate line within the table
The table shows how many notifications have been triggered over the period selected, and provides a break down based on the notification type and also provides a notification trend.
Each data point represents one week, any increases and decreases in the trend line indicate an increase or decrease in alert activity from week to week.
Users cannot drill into a given location to see further details of alert notifications.

Email Notifications for Alerts
Consumption Alert Email Notifications
An email will be sent to the designated person (as set up in location notification contacts) to alert them when the event has been triggered. The email notification has the following structure:
If not real time data:
[Alert Type] [And Raise]*
[Alert Name], consumption between [Monitor From] - [To] exceeded threshold of [Threshold] [Monitor] at [hh:mm Date]. Consumption recorded between [Monitor From] - [To] was [value] [Monitor], [X]% higher than the threshold.
Detected on [service point] , meter ref : [meter name], meter number : [serial number]
X = (cusum total for the alert period - threshold value) / threshold value x 100
*See section 6.3.1 for a description of each item contained in the [brackets].
Consumption (non-real time) example email:

If real time data:
[Alert Type] [And Raise]
[Alert Name], consumption between [Monitor From] - [To] exceeded threshold of [Threshold] [Monitor] at [hh:mm Date]. [Y]% through the monitoring period.
Detected on [service point] , meter ref : [meter name], meter number : [serial number]
Y = (Trigger Time - Monitor From) / (Monitor To - Monitor From) x 100
*See section 6.3.1 for a description of each item contained in the [brackets].
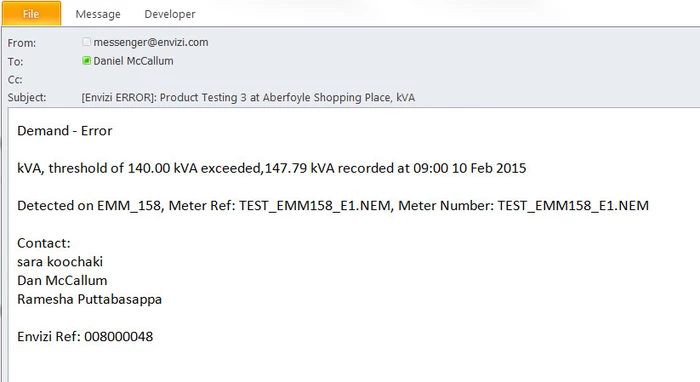
Demand Alert Email Notifications
An email will be sent to the designated person (as set up in the notification contacts) to notify them when the event has been triggered. The notification has the following structure:
[Alert Type] [And Raise]*
[Alert Name], demand of [Threshold] [Monitor] exceeded,[Value] [Monitor] recorded at [hh:mm Date]
Detected on [service point] , meter ref : [meter name], meter number : [serial number]
*See section 6.3.2 for a description of each item contained in the [brackets].
Demand example email: