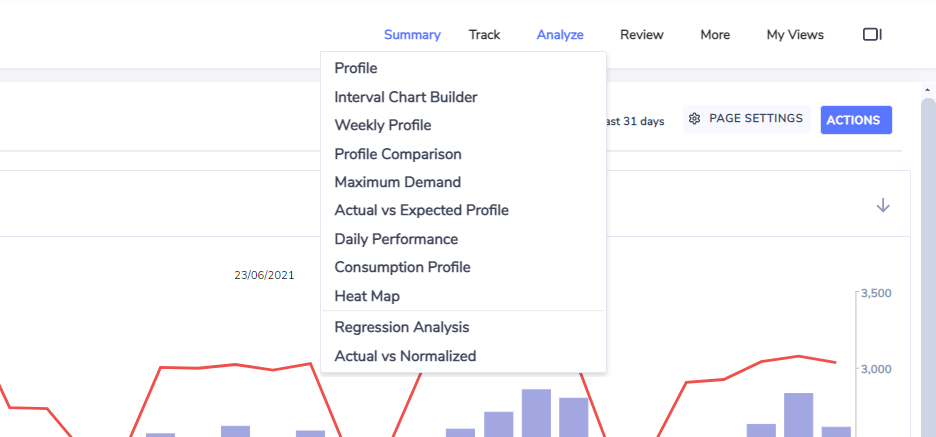
Analyzing Meter Data
The Analyze dashboards at the meter level visualize interval meter data.
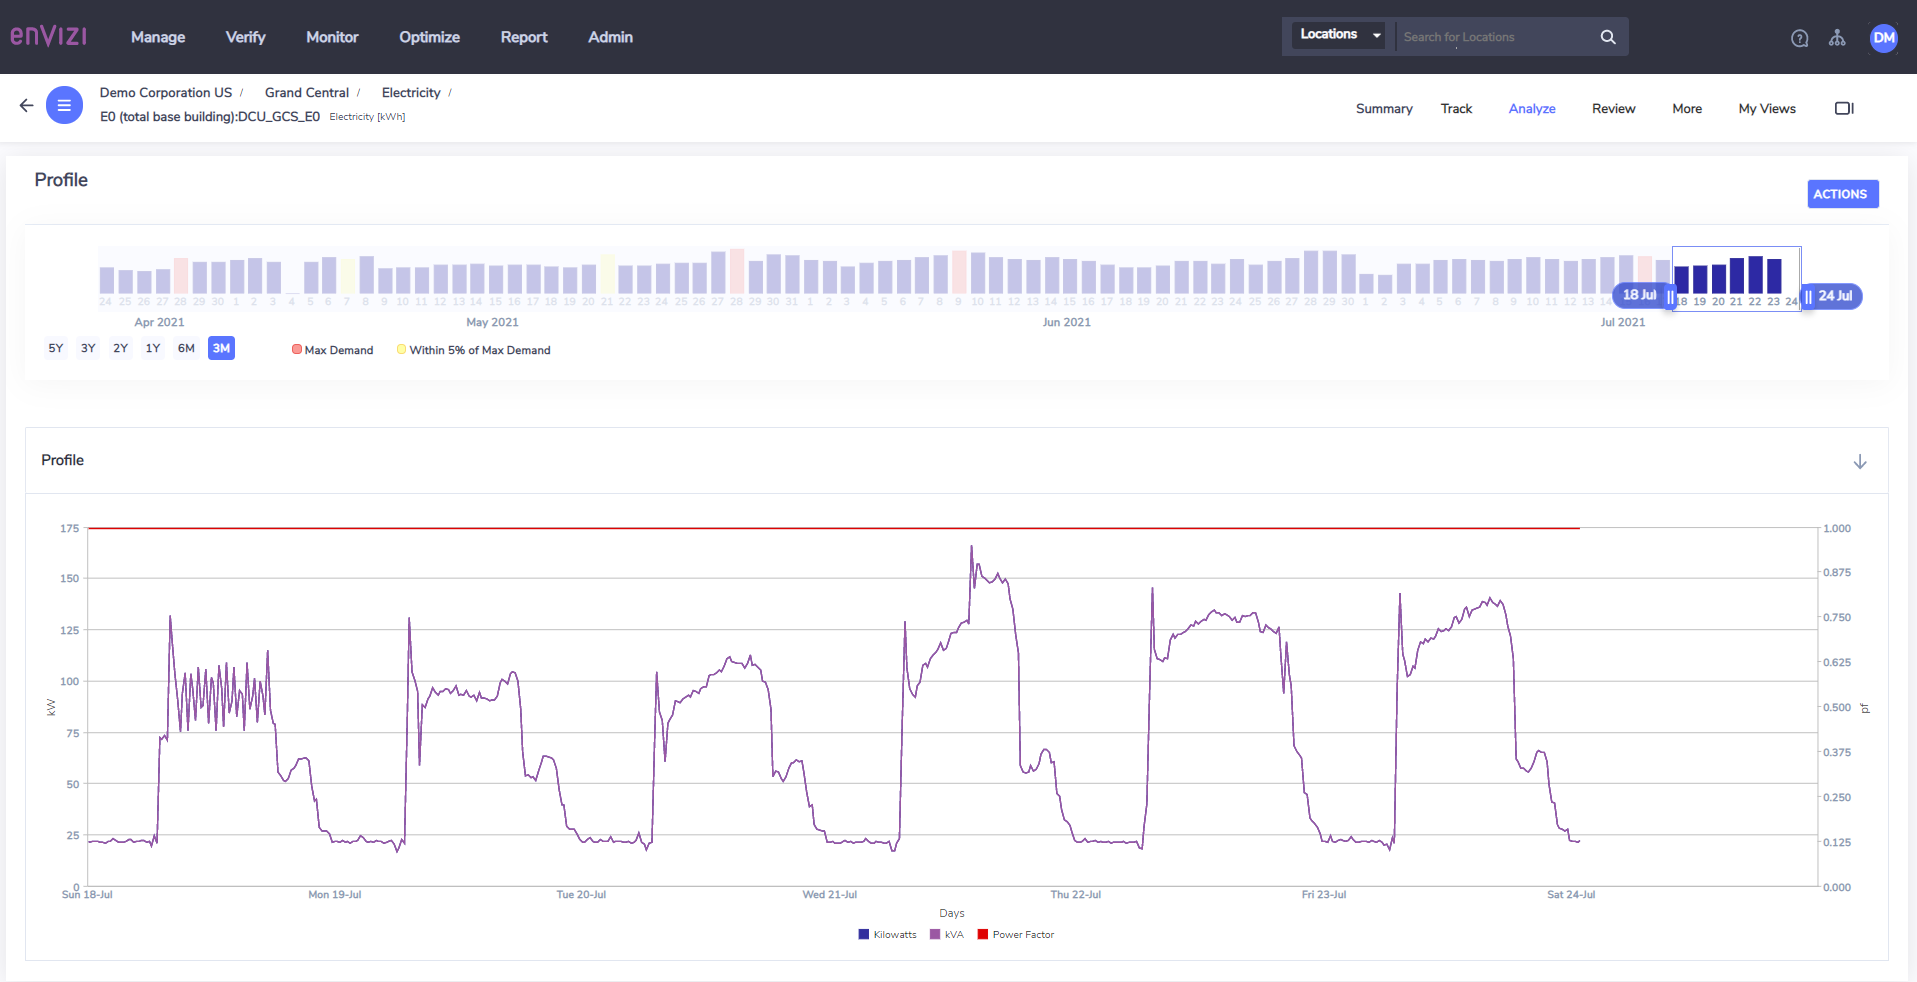
Profile
The Profile dashboard displays demand related measures in series. The default time period selected is the most recent 7 days. Up to 31 days can be selected using the time navigator.
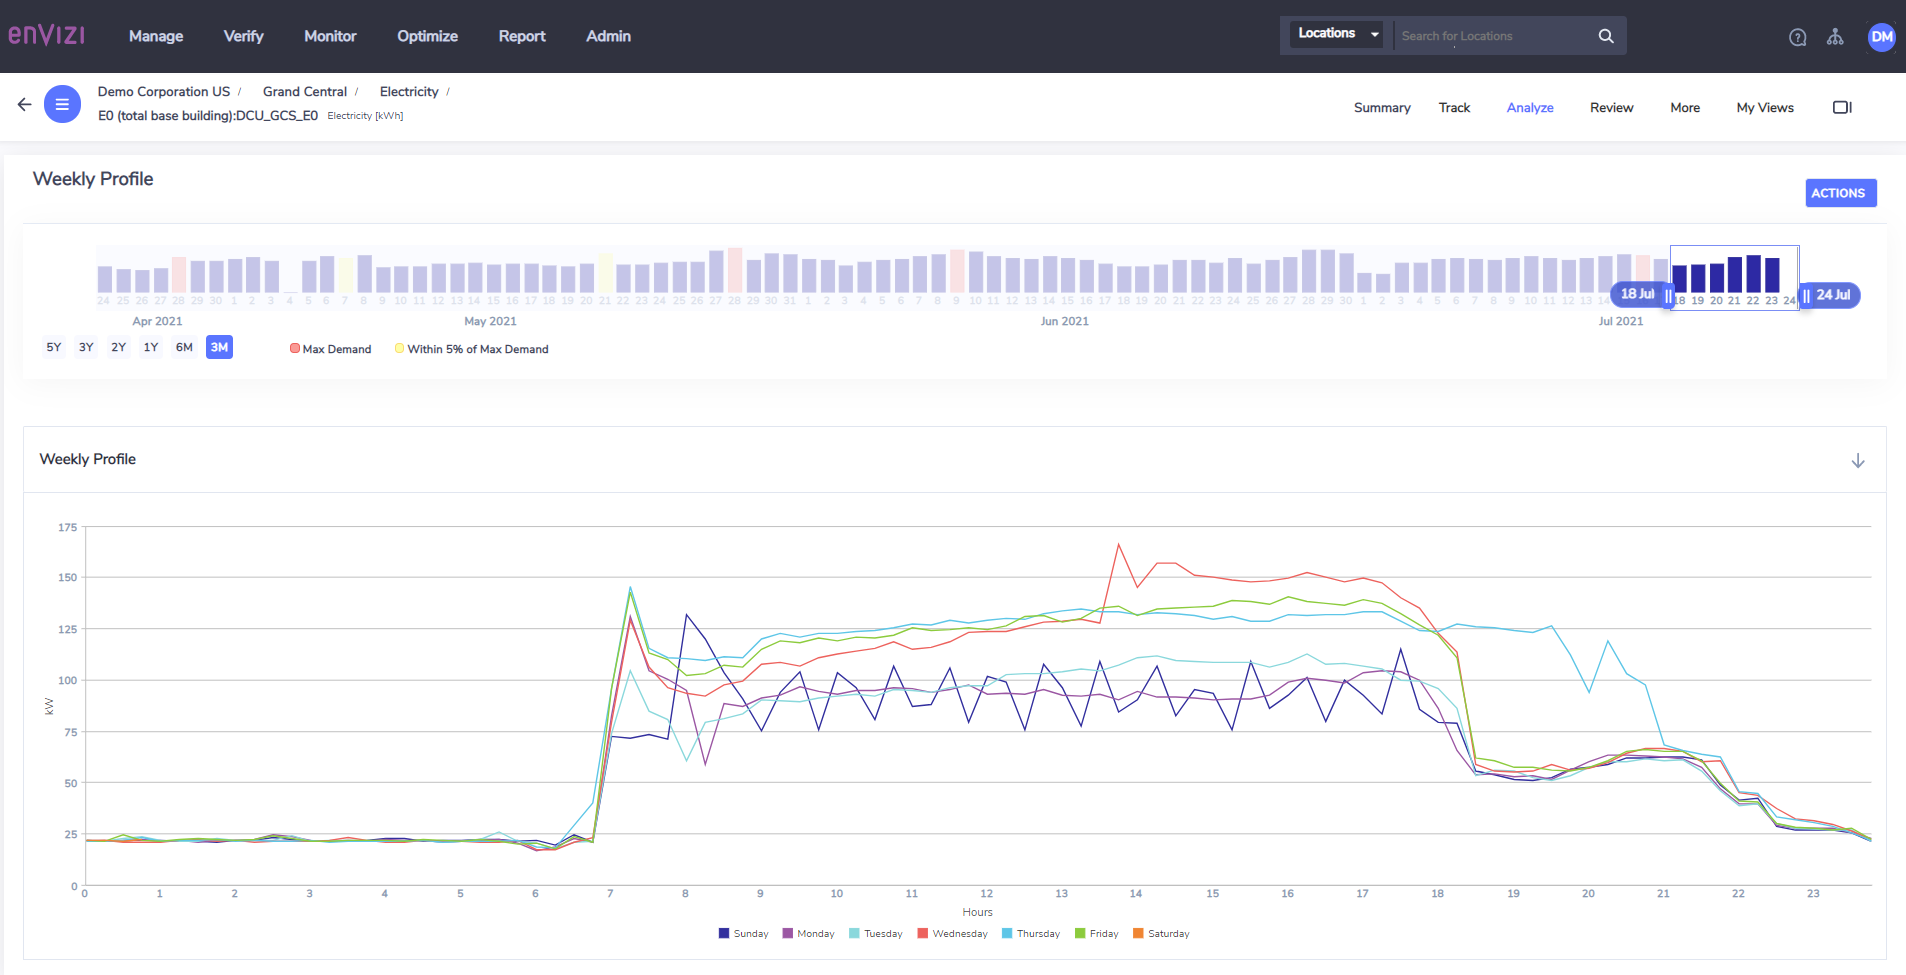
Weekly Profile
The Weekly Profile graph allows a user to overlay the demand profiles of up to 7 days in series. This dashboard is supported for electricity and non electricity data sources.
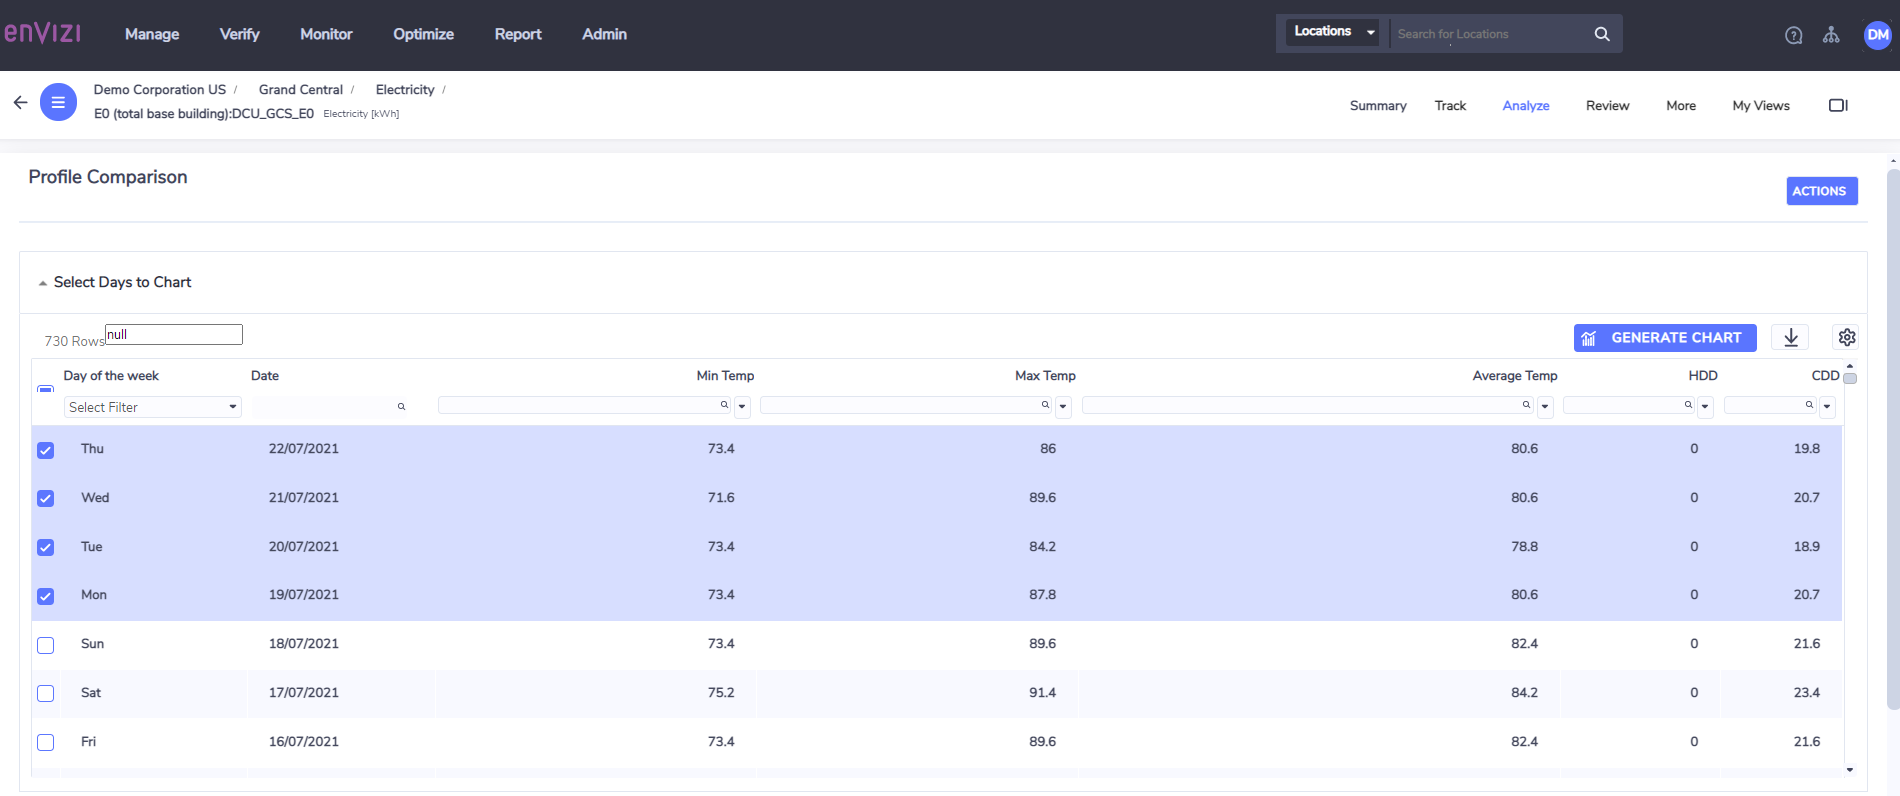
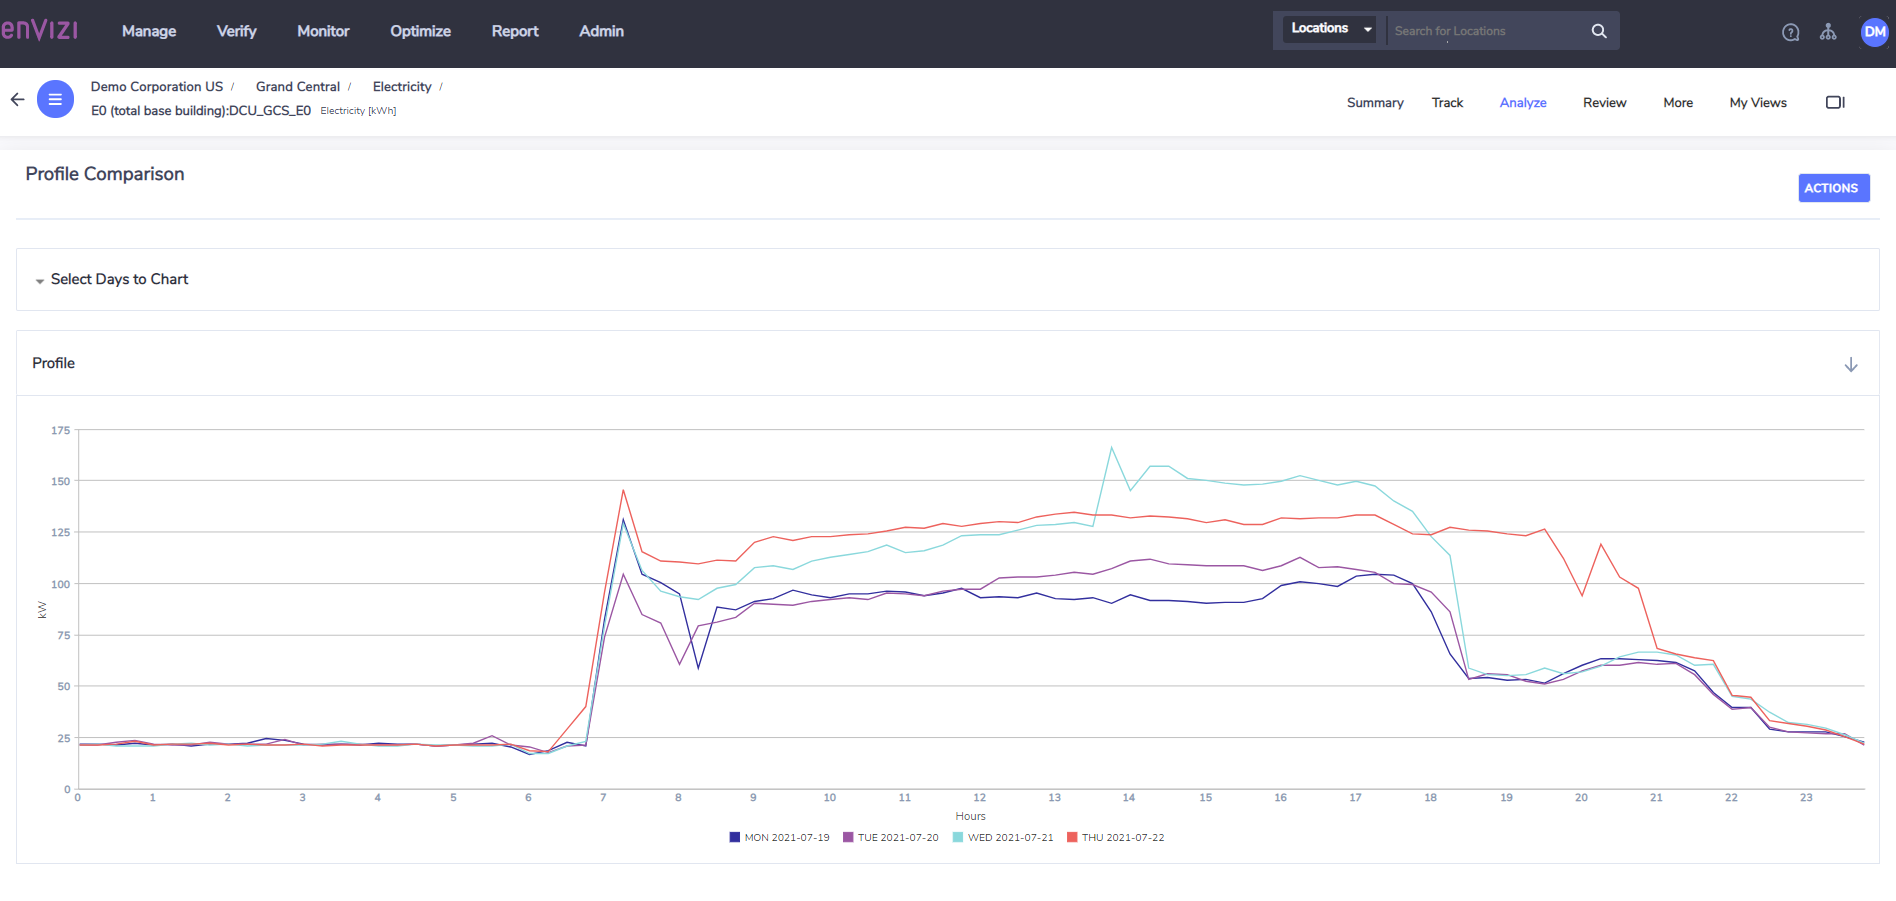
Profile Comparison
The Profile Comparison dashboard allows a user to overlay the demand profile of multiple days (up to 31) based on a user defined scenario.
Select the data points to display from the Select Days to Chart section. The table includes weather metrics related to each day (the weather data is drawn from the weather station assigned at the location level). The information in the table can be filtered to select information of interest (e.g only show Mondays, or show days above a given temperature).
Once you have selected the criteria of interest to you, select the days you wish to visualize by checking the box in the left hand column.
Click the Generate Chart button. The table will then collapse and the chart will be displayed below.
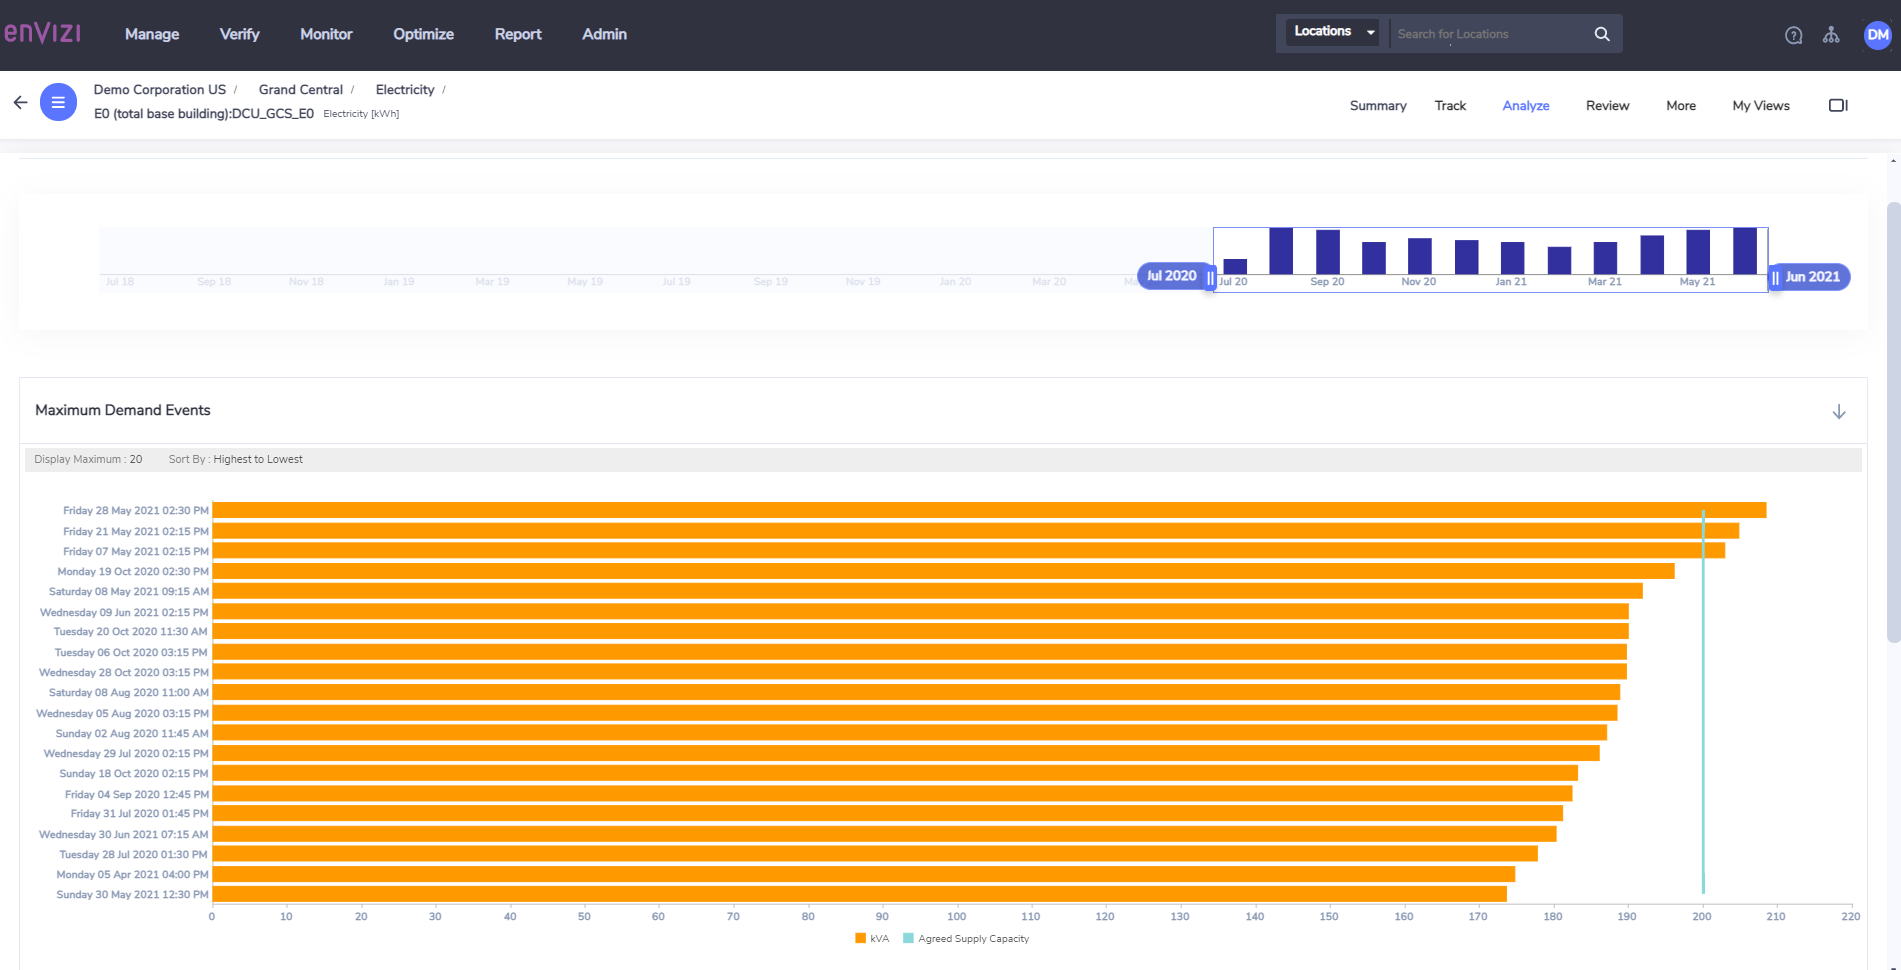
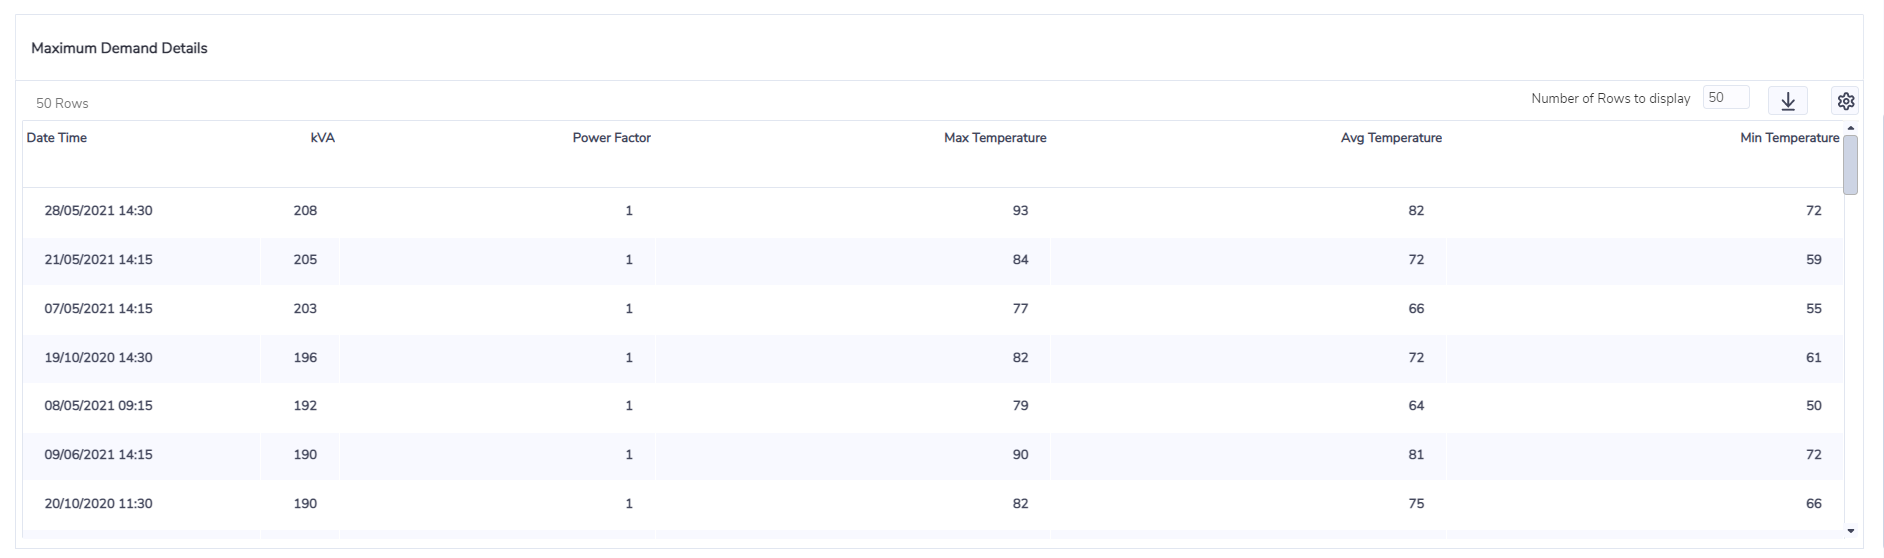
Maximum Demand
The Maximum Demand Dashboard allows a user to rank maximum demand events in order from highest to lowest. A maximum demand event is defined as the maximum recorded demand (kVA) for a given day. If kVA is not captured for a given meter, then kW will be displayed. If kW aren't captured, then the dashboard will return no data. If the meter is not an electricity meter, then a message will pop-up to say that this dashboard is not supported for this meter type.
The amount of data shown in the chart and the grid can be changed by using the setting icon on the chart, and the "number of rows to display" option in the grid.
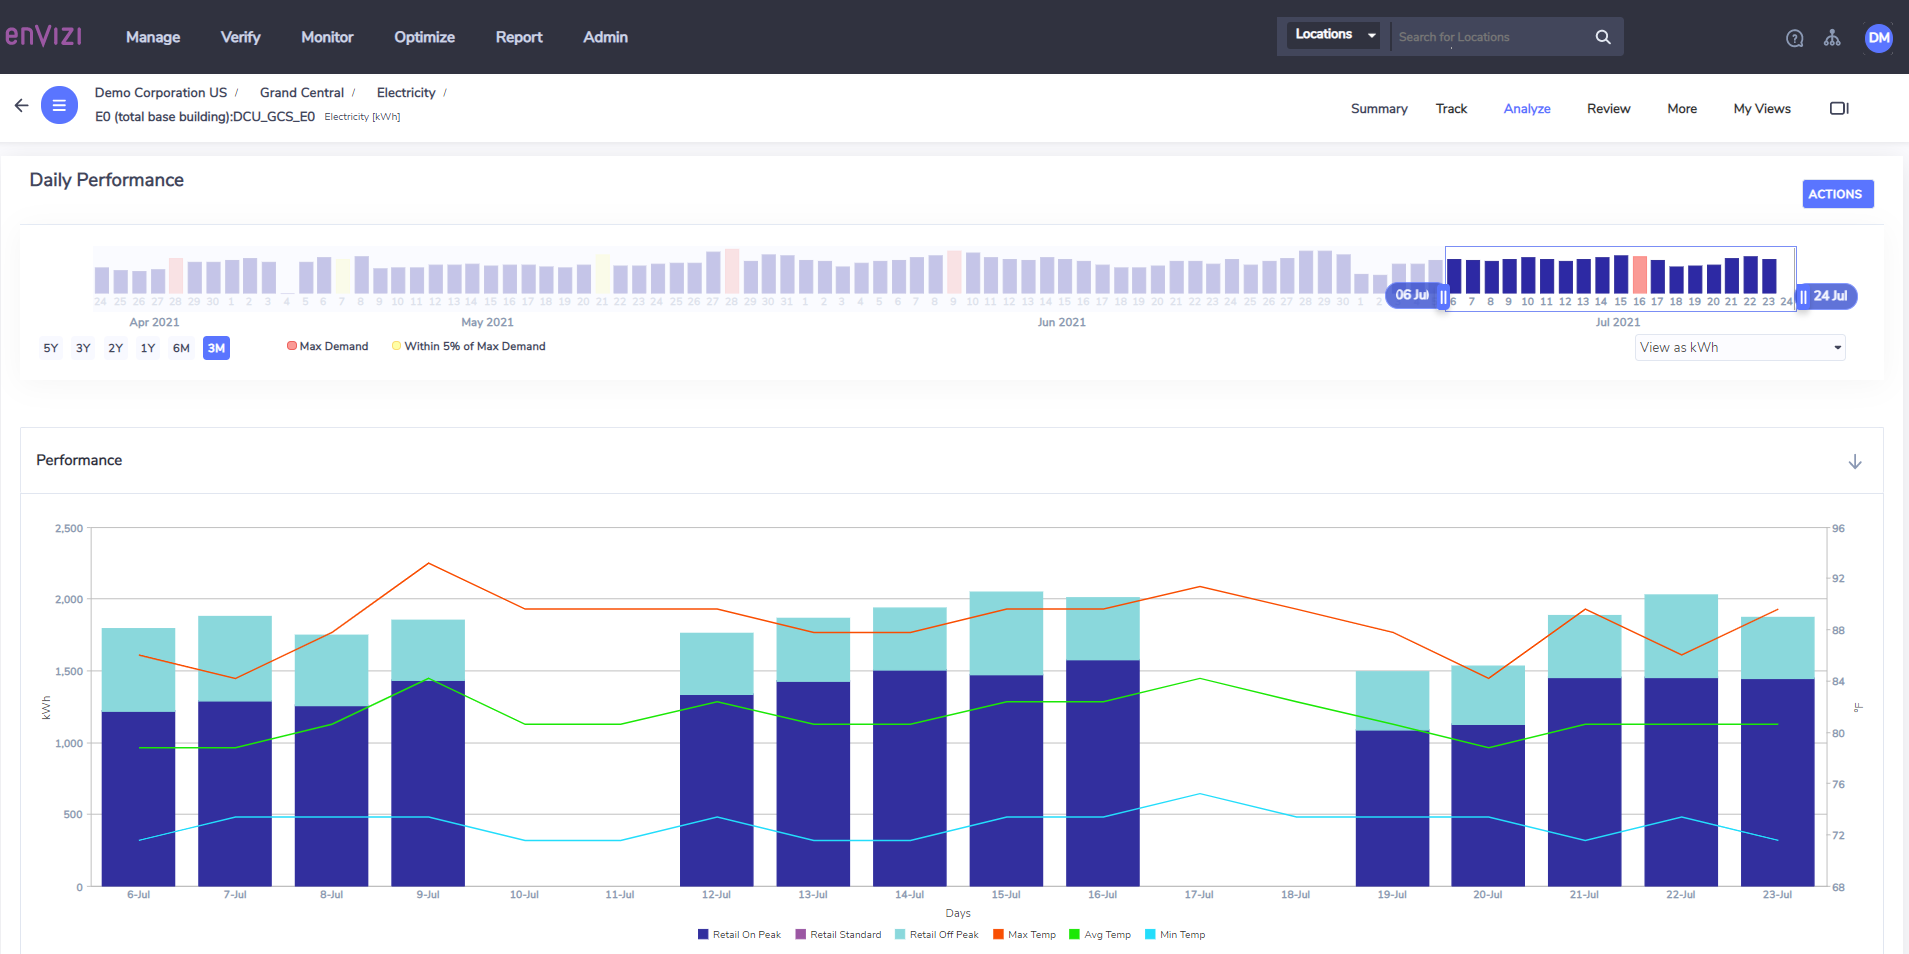
Daily Performance
The Daily Performance dashboard functions on two levels, daily and intra-day. If using the daily function (selecting two or more days from the time navigator), consumption is presented on a daily basis. Up to 31 days can be selected in the time navigator.
In addition to daily consumption information, average, min and max temperature is also included as a secondary axis. If using the intra-day function (by selecting a single day in the time navigator) the Daily Performance dashboard will display hourly consumption across that given day.
This dashboard supports electricity and non electricity data types.
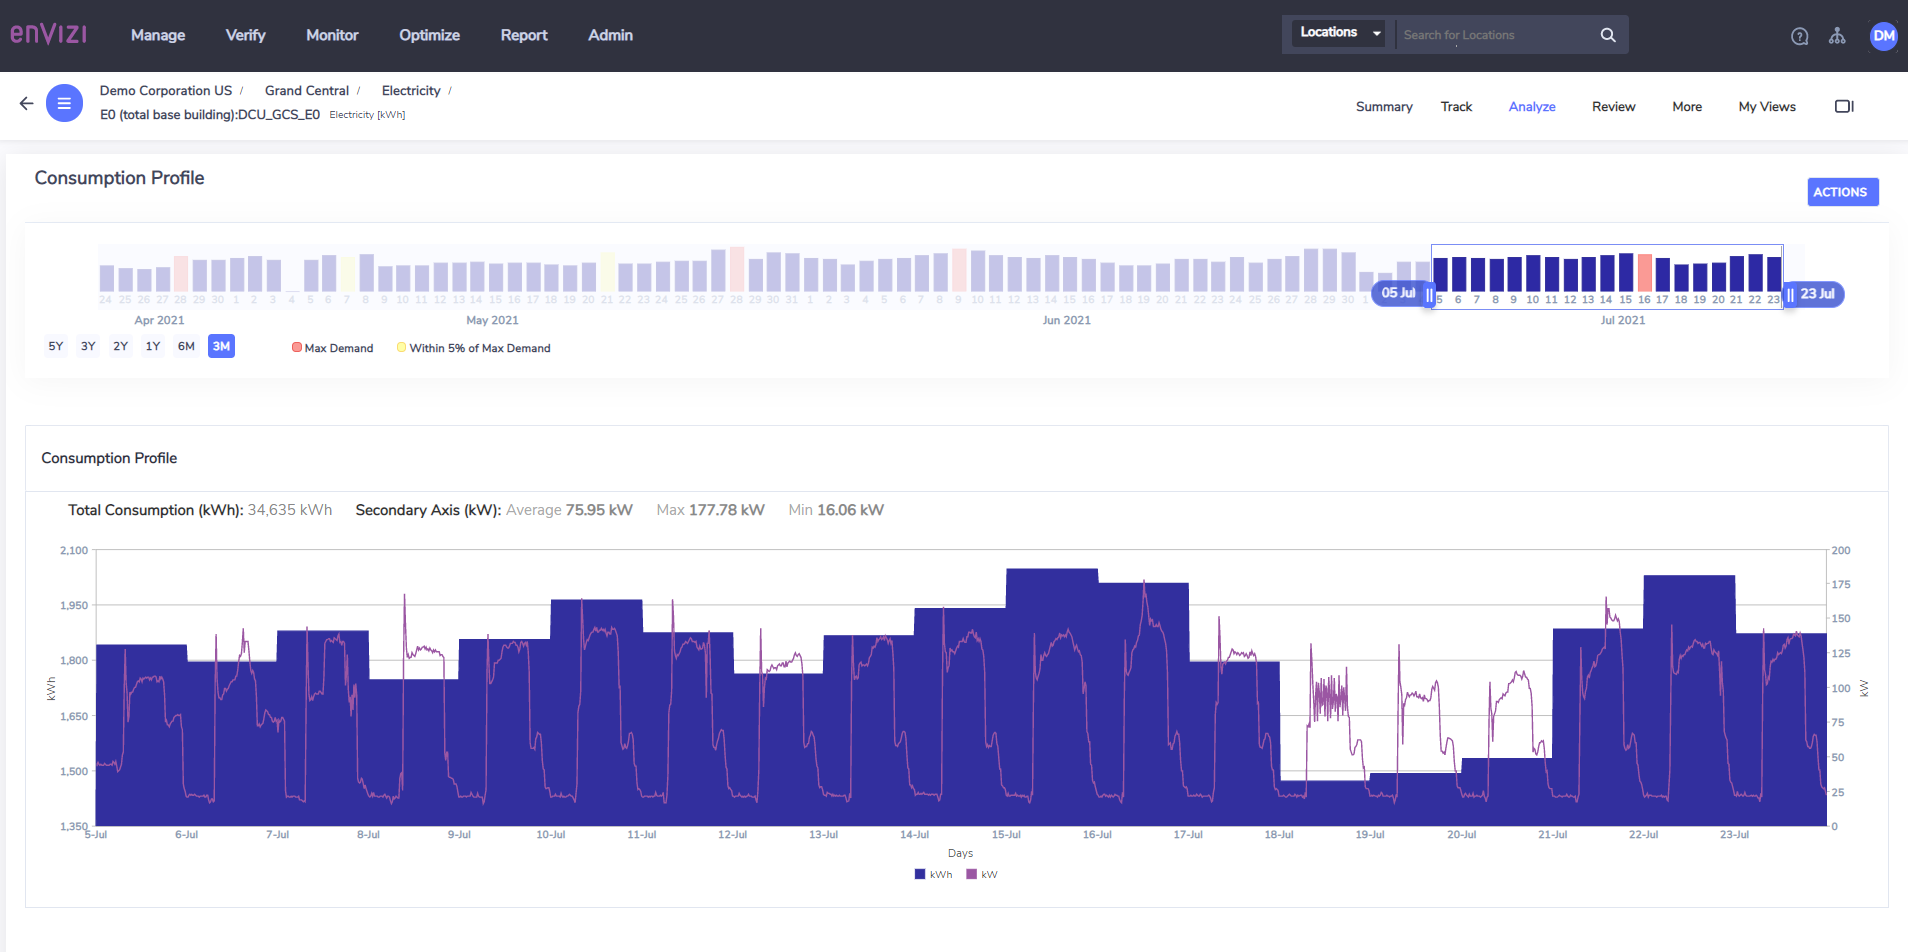
Consumption Profile
The Consumption Profile dashboard allows a user to view consumption information and overlay a profile line on a secondary axis. It also provides a summary of consumption and profile information. The main use case for this dashboard is analyzing the drivers behind consumption trends.
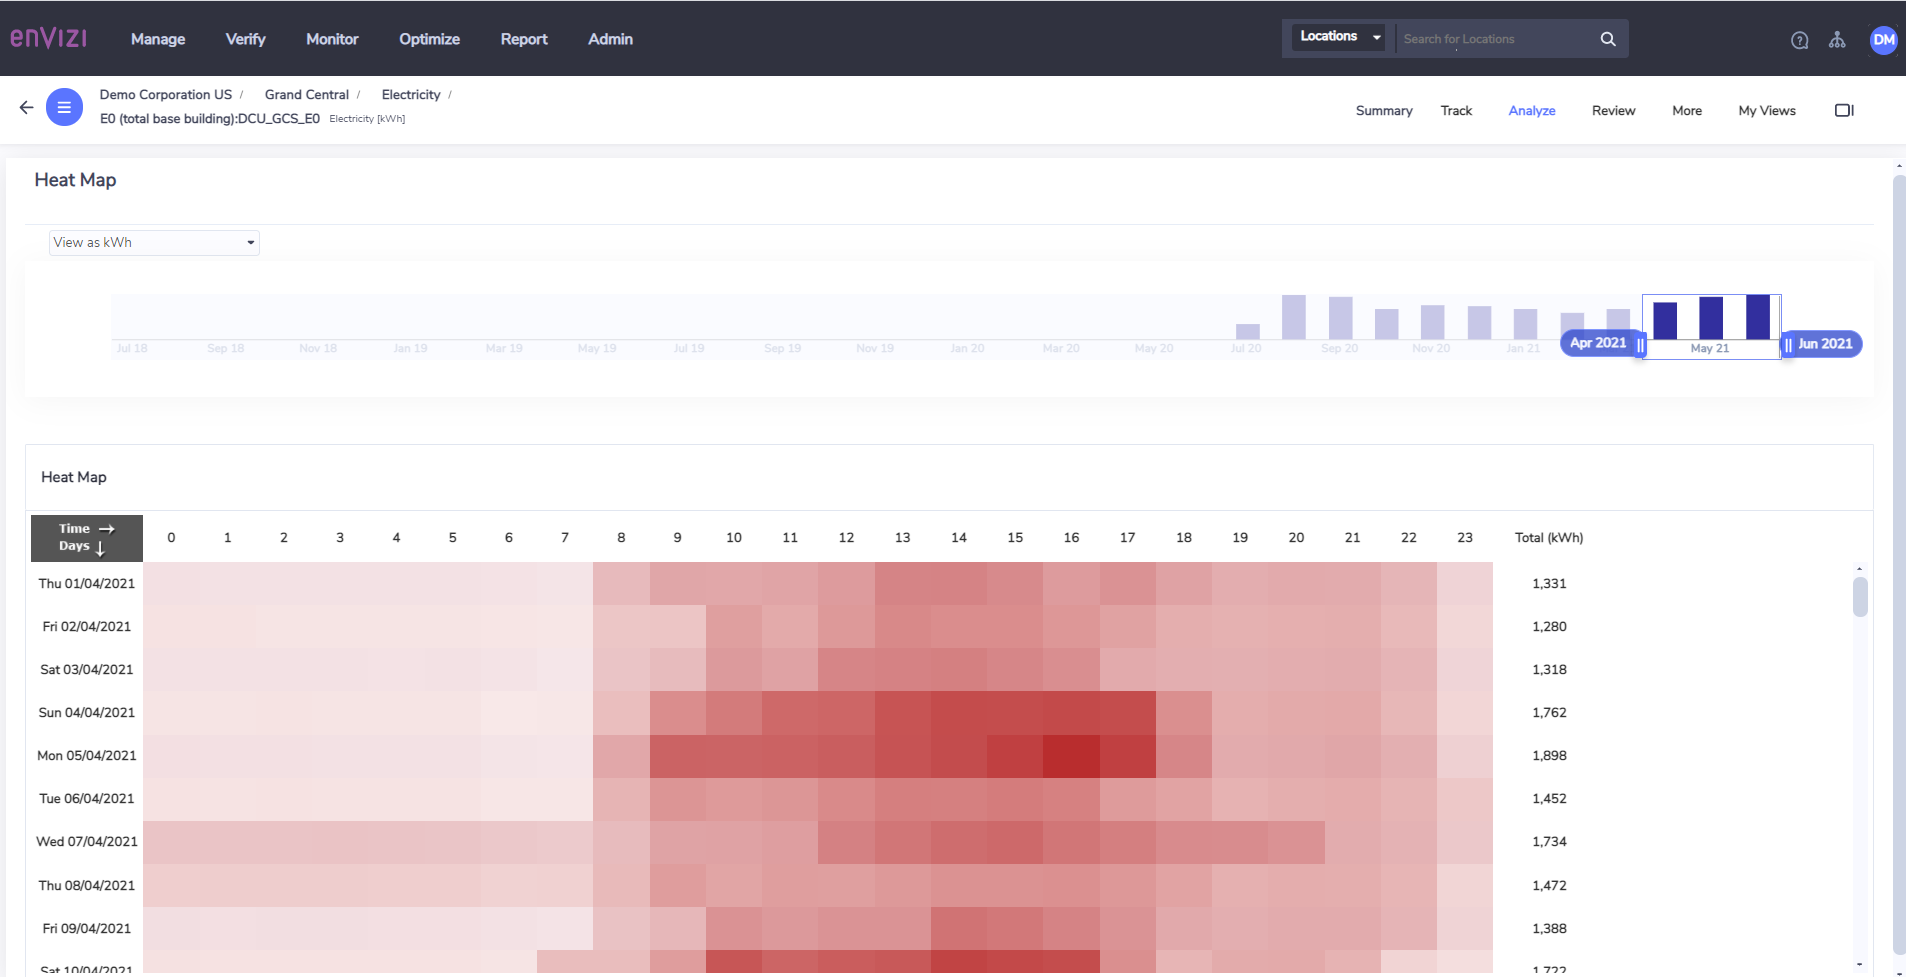
Heat Map
The Heat Map provides a way to visualize up to 3 months of interval meter data in a simplistic and easy to use interface. It displays hourly consumption information in a matrix. Each square within the matrix represents consumption on a given day in a given hour (days run top to bottom, hours run left to right).
The color of the square indicates the relative consumption - the darker the color the higher the consumption. You can scroll down the heat map to view up to 3 months of consumption information.
Regression Analysis
The Regression Analysis Tool is used to carry out baseline regression analysis of consumption against heating and cooling loads or against other performance metrics that are predictive of consumption.
The regression analysis tool helps you identify correlation between consumption and these predictive variables that can be used to predict consumption.
Review
The Review menu contains report content related to interval meter data that can be extracted from the system.

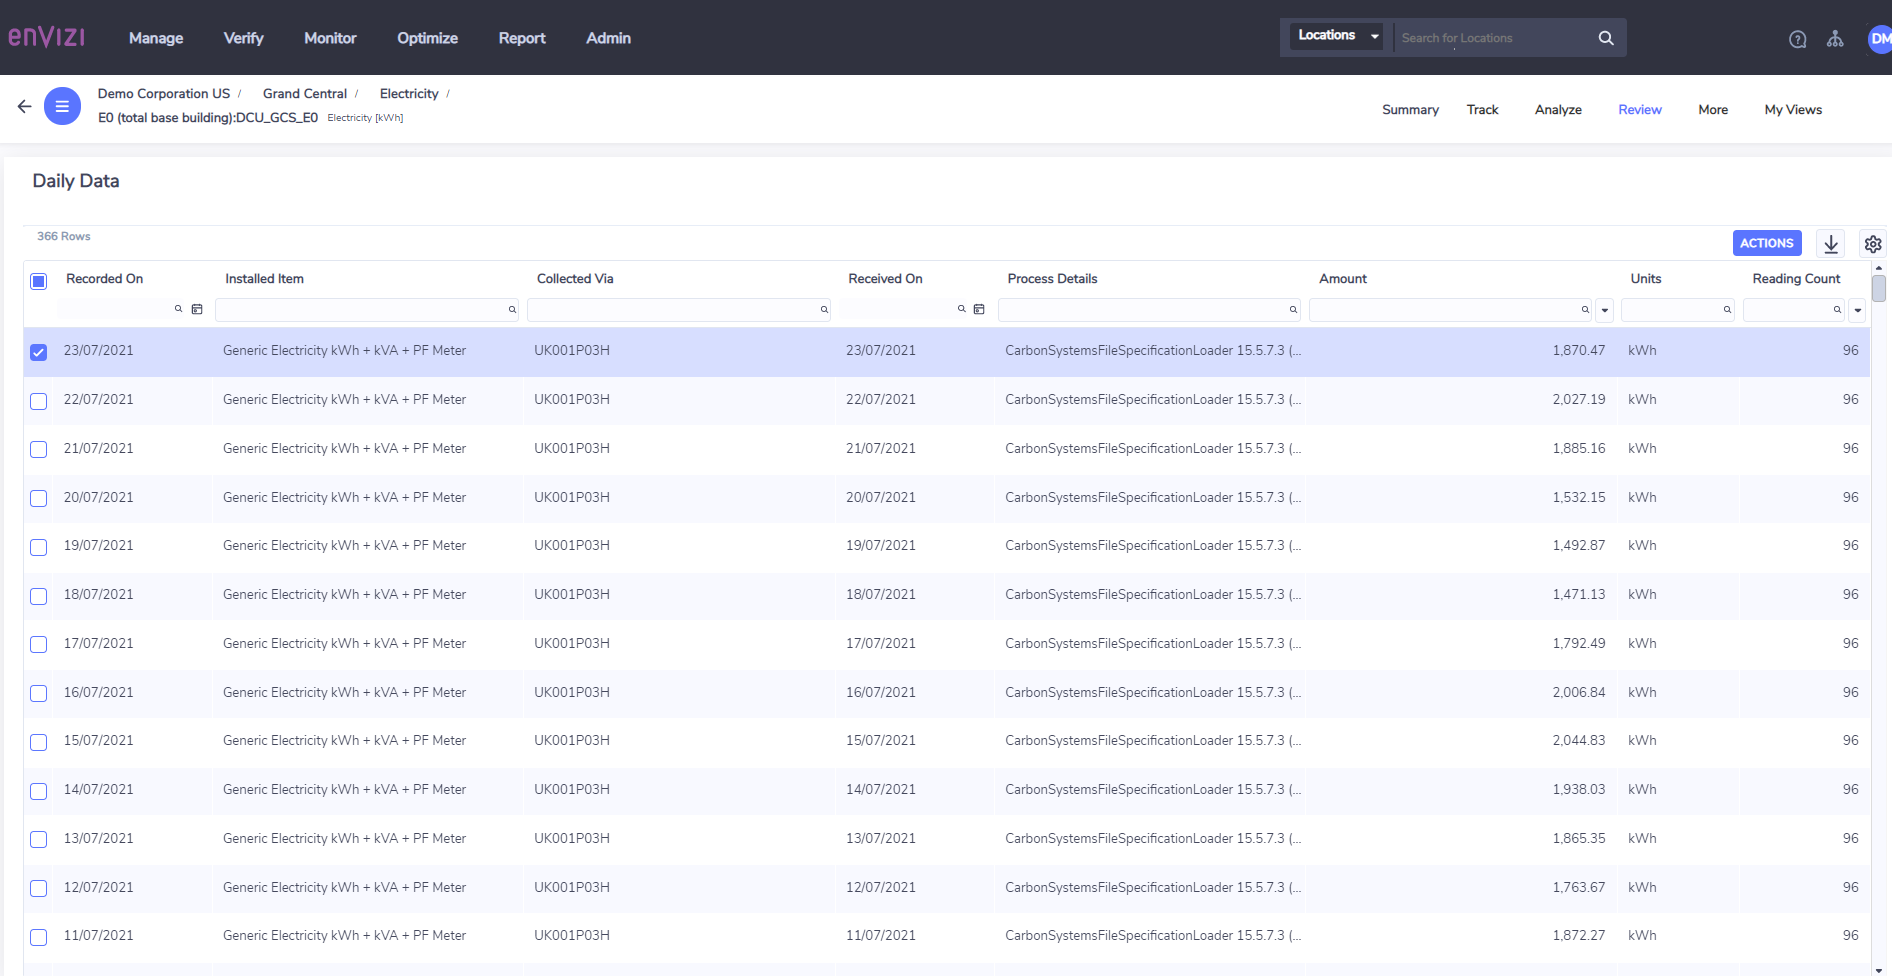
Daily Data
The Daily Data option provides daily summary information for a given meter.
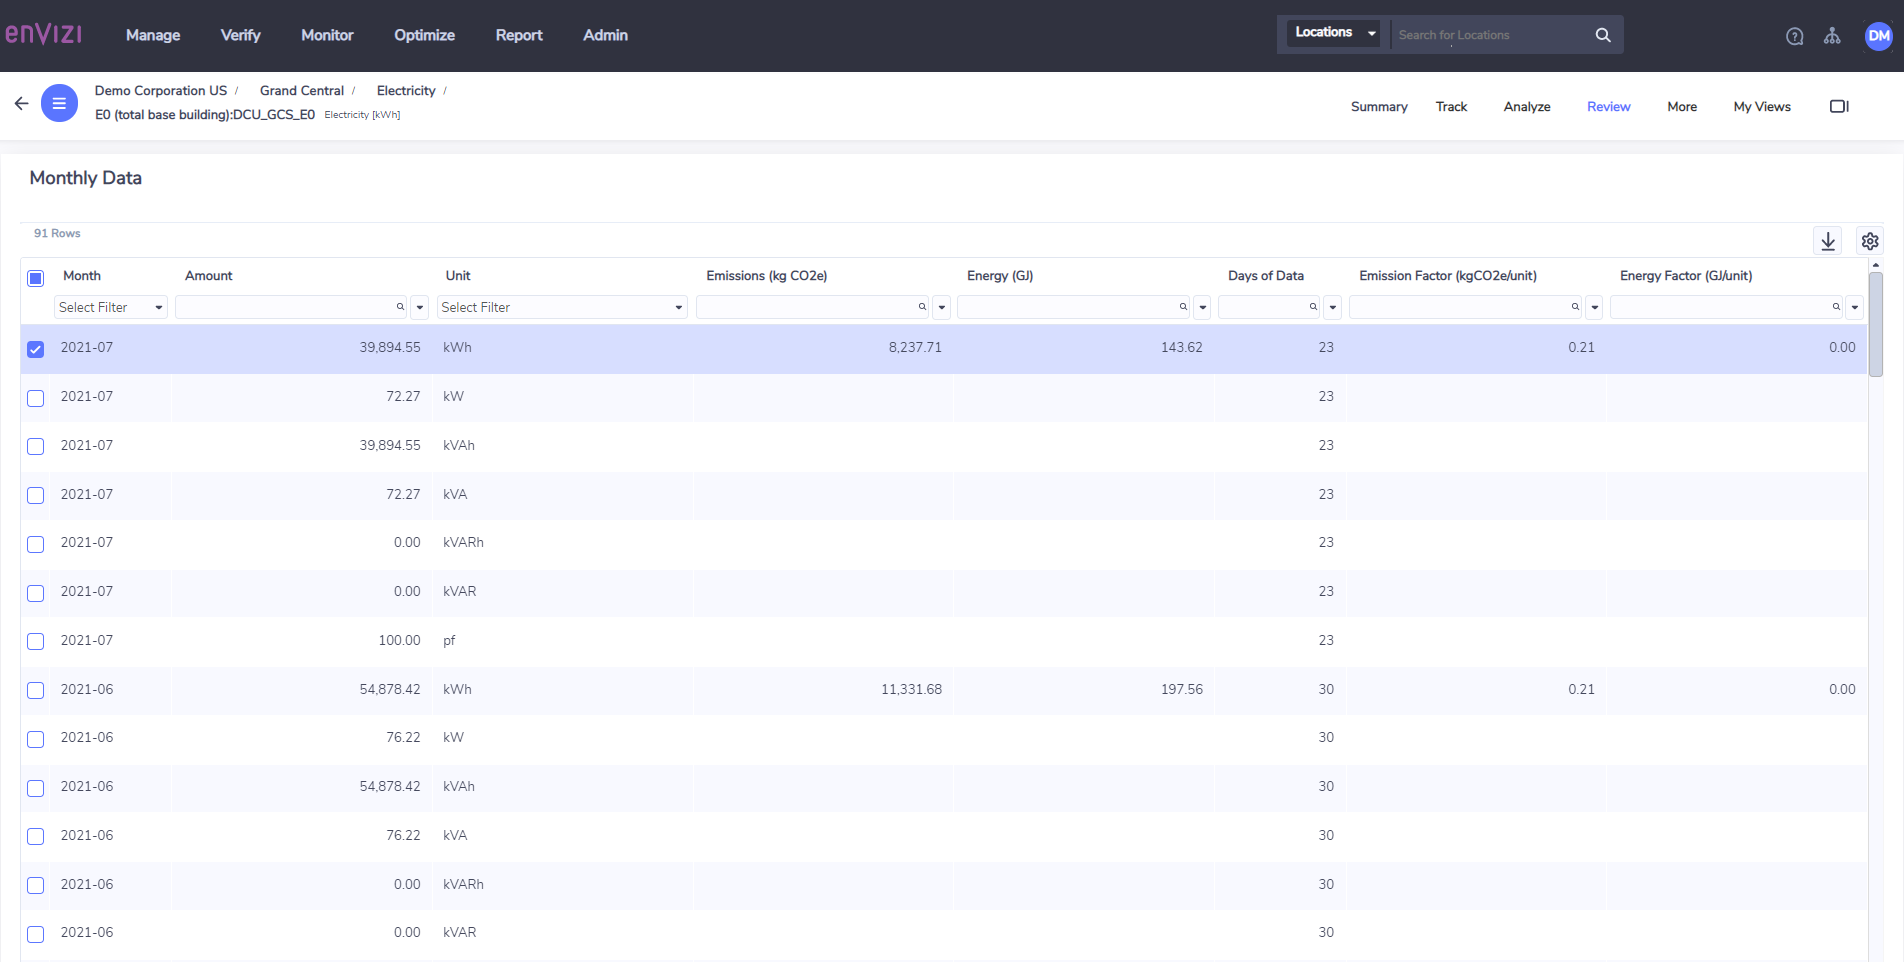
Monthly Data
The Monthly Data option is similar to the Daily Data screen, however rather than providing a daily summary it provides a monthly summary.
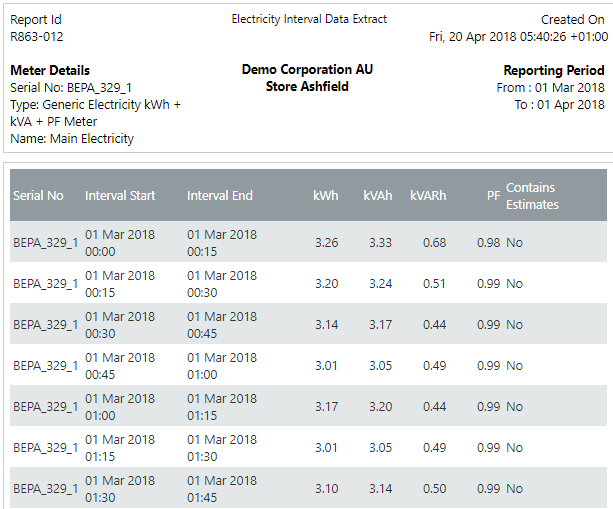
Interval Data Extract
The Interval Data Extract report is different from the daily and monthly data grids. The Interval Data Extract report takes you to the report menu and will automatically open the "Extract Electricity Interval Data" report. You can select a time period then run the report. This is only supported for Electricity data. To extract interval data for non electricity meters use the report menus to select the relevant extract report (currently supported for Gas and Water).
You can setup absolute alert rules from the Interval Meter Alert center or directly from Absolute Rules which can found in the meter More sub-menu
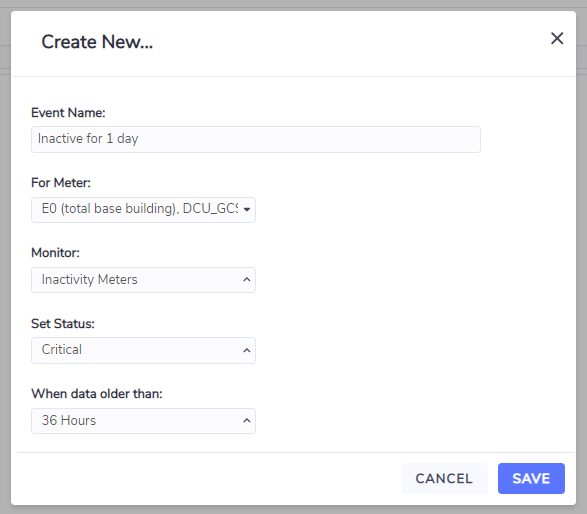
Inactivity Rules
Inactivity Rules allow you to configure a rule to alert you if data is not uploaded for a given meter within a user defined time period.

If the rule condition is met, the notification contact/s set for the location for the status of that rule will receive an email notification.
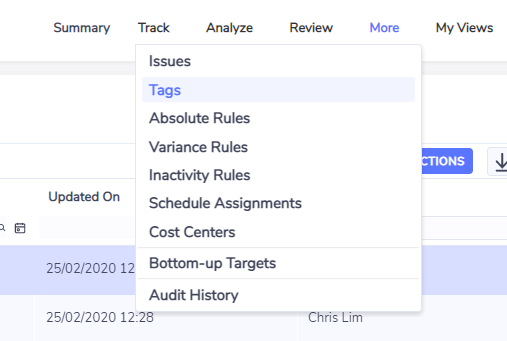
Tags
Tags allow a meter to be tagged with a defined classification (e.g. HVAC). Tags are also used to configure rules governing if the meter's data is rolled into location, group or organizational level reporting (i.e. Consolidation Rule).