
Program Management Overview
Programs Summary Page
In the main menu structure the module is accessed via Optimize > Programs
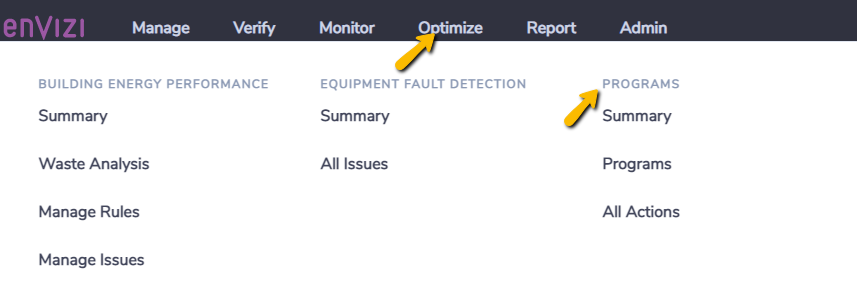
Once in the Program module, you use the sub menus to toggle between the module functions.

Summary: Summary page to give a high level overview of Programs data including basic dashboard functionality and knowledge based checks.
Manage & Track: Grids to manage Programs, Action Plans, and Actions.
Monitor Results: Reporting outputs for Programs.
The Programs summary page provides you with an overview of your programs and offers you various options of how to view your program data summary.
Summary of Program Data
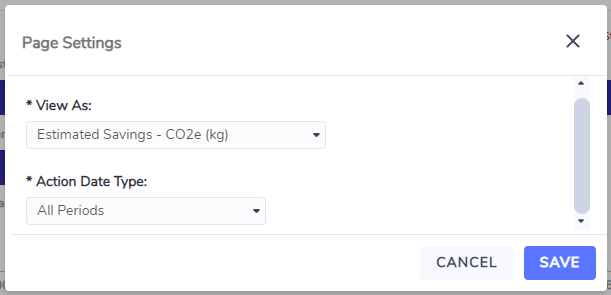
Page Settings
Click on the 'Page Settings' button in the top right of the page to change your page settings.

Here you can select how you compare Programs. Selections include:
Annual Emissions Savings
Annual Energy Savings
Annual Cost Savings
Implementation Cost
Count of Actions
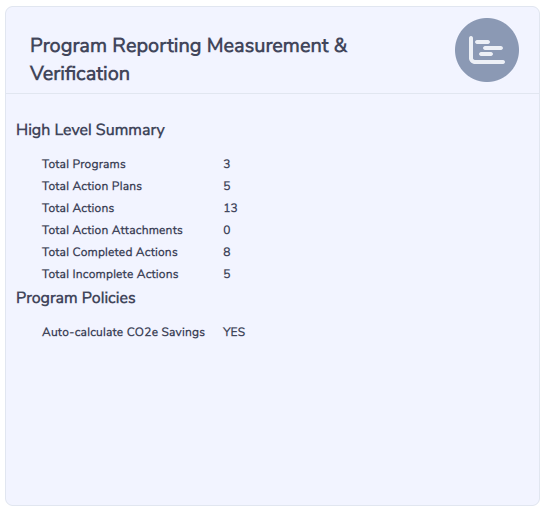
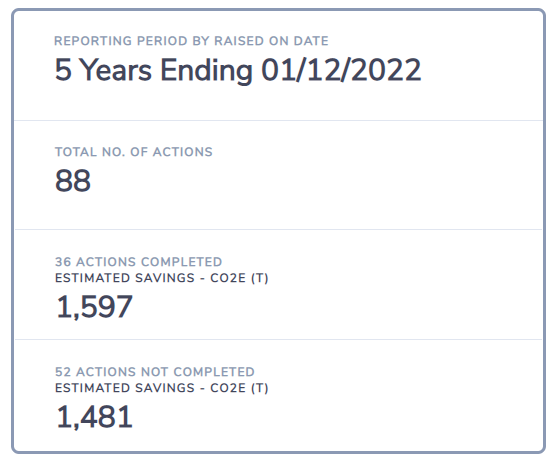
Summary Totals
The information shown in the summary total boxes will depend on what you have selected as your page settings.
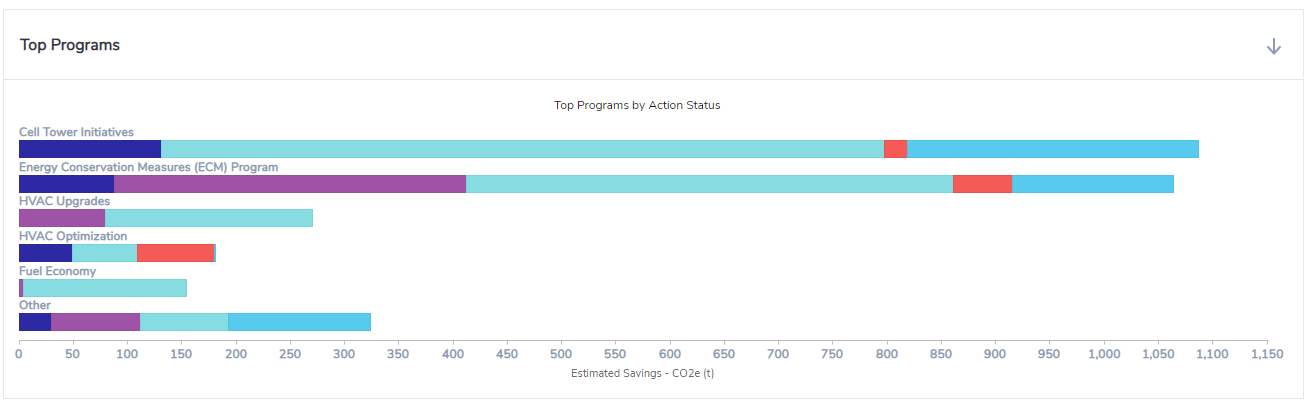
Programs by Action Status
This chart allows you to see the top 6 Programs (based on the criteria you selected in the page settings) and you can see a breakdown by status when you hover over the bars.
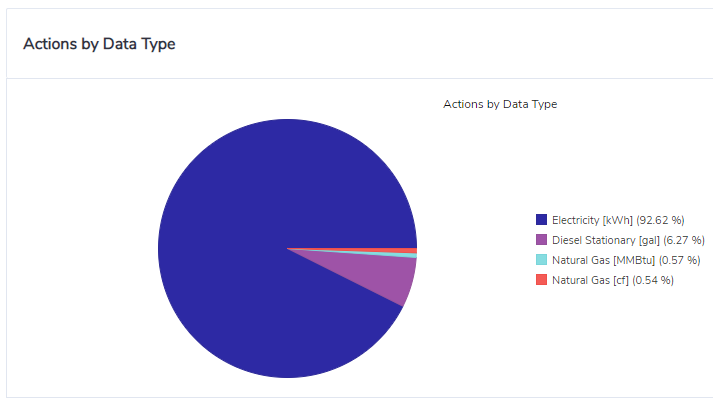
Actions by Data Type
This chart allows you to view the breakdown of your programs by data type (base on the criteria you selected in the page settings).You can see the value the slice of the pie represents when you hover over the slice.
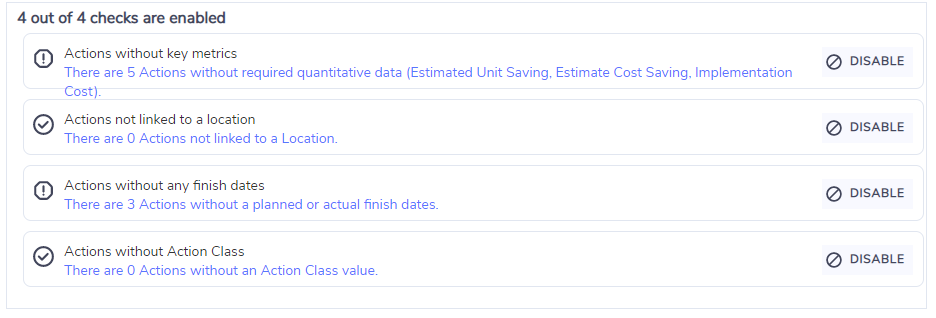
Program Data Quality Checks
In order to assist you to ensure high quality program data so that any analysis you do is accurate and meaningful, the checks at the bottom of the summary page highlight data issues for you to follow up on.
Programs, Action Plans and Actions grids
To view more detail or to drill down to view individual actions, see Programs, Action Plans and Actions Grids.
Program Notes and Attachments
Users can also make note and attachments to Actions in the Actions grid.
Monitor Results
All Program specific reports are available under the Programs sub-menu Monitor Results:
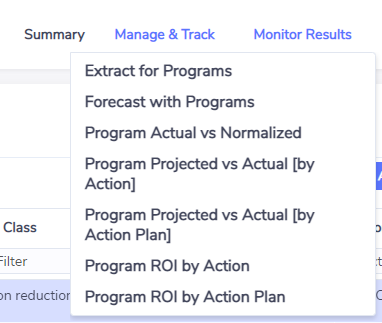
Extract for Programs
An Extract of all Programs information. This report is useful for pivoting in Excel to customize an aggregated view on programs and actions.
Forecast with Programs
This report provides actual and forecast consumption along with savings achieved through Programs. Note: It is recommended that you select Location or Item level targets when running this report.
Program Actual vs Normalized
This report shows Actual consumption against Expected (Weather Normalized) consumption for Actions that are linked to interval data meters. The variance between the two (Expected - Actual) indicates the potential savings incurred. **Note**: It requires additional setup for Locations (HDD/CDD base temperatures) and HDD/CDD Slope co-efficients for the individual meters concerned, and utilizes weather station data linked to the location to determine daily HDD/CDD values.
Program Projects vs Actual (by Action)
This report shows per program, location, calendar month and data type - actual consumption vs projected consumption (defined as prior year actuals less savings from actions completed in the period). It is to be run when a single initiative is identified as an action. **Note**: actions within the action plan must be linked to the appropriate locations and accounts, and have inputted ‘actual finish dates’ for data to appear. The actions’ actual finish dates must sit within the date period selected. Initiative savings are averaged out per month based on annual total and persist for only 1 calendar year post completion date (starts on the first month after completion)
Program Projects vs Actual (by Action Plan)
This report shows per Program, location, calendar month and data type - Actual Consumption vs Projected Consumption (defined as Prior year Actuals less Savings from Actions completed in the period). It is to be run when a single initiative is identified as an Action Plan. **Note**: Actions within the Action Plan must be linked to the appropriate locations and accounts, and have inputted ‘Actual Finish Dates’ for data to appear. The Actions’ Actual Finish Dates must sit within the Date period selected. Initiative savings are averaged out per month based on annual total and persist for only 1 calendar year post completion date (starts on the first month after completion)
Program ROI by Action
This report displays the program initiatives aggregated by Action which fit within an ROI timeframe
Program ROI by Action Plan
This report displays the program initiatives aggregated by Action Plan which fit within an ROI timeframe.
Required Data
Project data is required for implementation of the Programs module. This is typically data relating to Energy Conservation Measures (ECMs), energy savings measures and related projects that have an energy and financial impact. Often - this data is a component of energy audits that are commissioned across a portfolio of sites within an organisation. The Programs module allows you to capture this data into a single system of record in Envizi for ongoing management.
Projects are usually commissioned and investigated for specific sites, and within those sites specific pieces of equipment such as meters or accounts. For this reason, it is usually beneficial that Envizi Locations, Accounts and Meters have been setup already so that the projects setup under the Envizi Programs module can be linked to those items. This allows for the quantification of estimated and actual savings. Although Programs data in Envizi can be used in isolation - at the very least there should be Envizi locations already setup before Programs data is entered.
Policies and Settings
There are policies and settings that can be applied at the Organization level for Programs. If you are an Organizational level System Administrator you will be able to change these settings.
Programs Configuration
A Program is essentially a set of initiatives that have a commonality and thus need to be grouped together. This can be based on a number of factors such as time, ownership, control, type of measures, or financial source.
Programs data can be configured in different ways with the two main options for configuring Programs being Simple or Complex.