CRREM Scenario Modeler PowerReport
About this PowerReport:
The CRREM Scenario Modeler is a PowerReport designed to support Carbon Risk Real Estate Monitor forecasting and estimation. It facilitates the creation and fine-tuning of future scenarios, enabling you to assess the effectiveness of planned projects and retrofits across various locations and portfolios within your organization.
Getting Started:
To configure the required ratios and targets within Envizi, please refer to and follow the documentation provided at the following link.
Using the report:
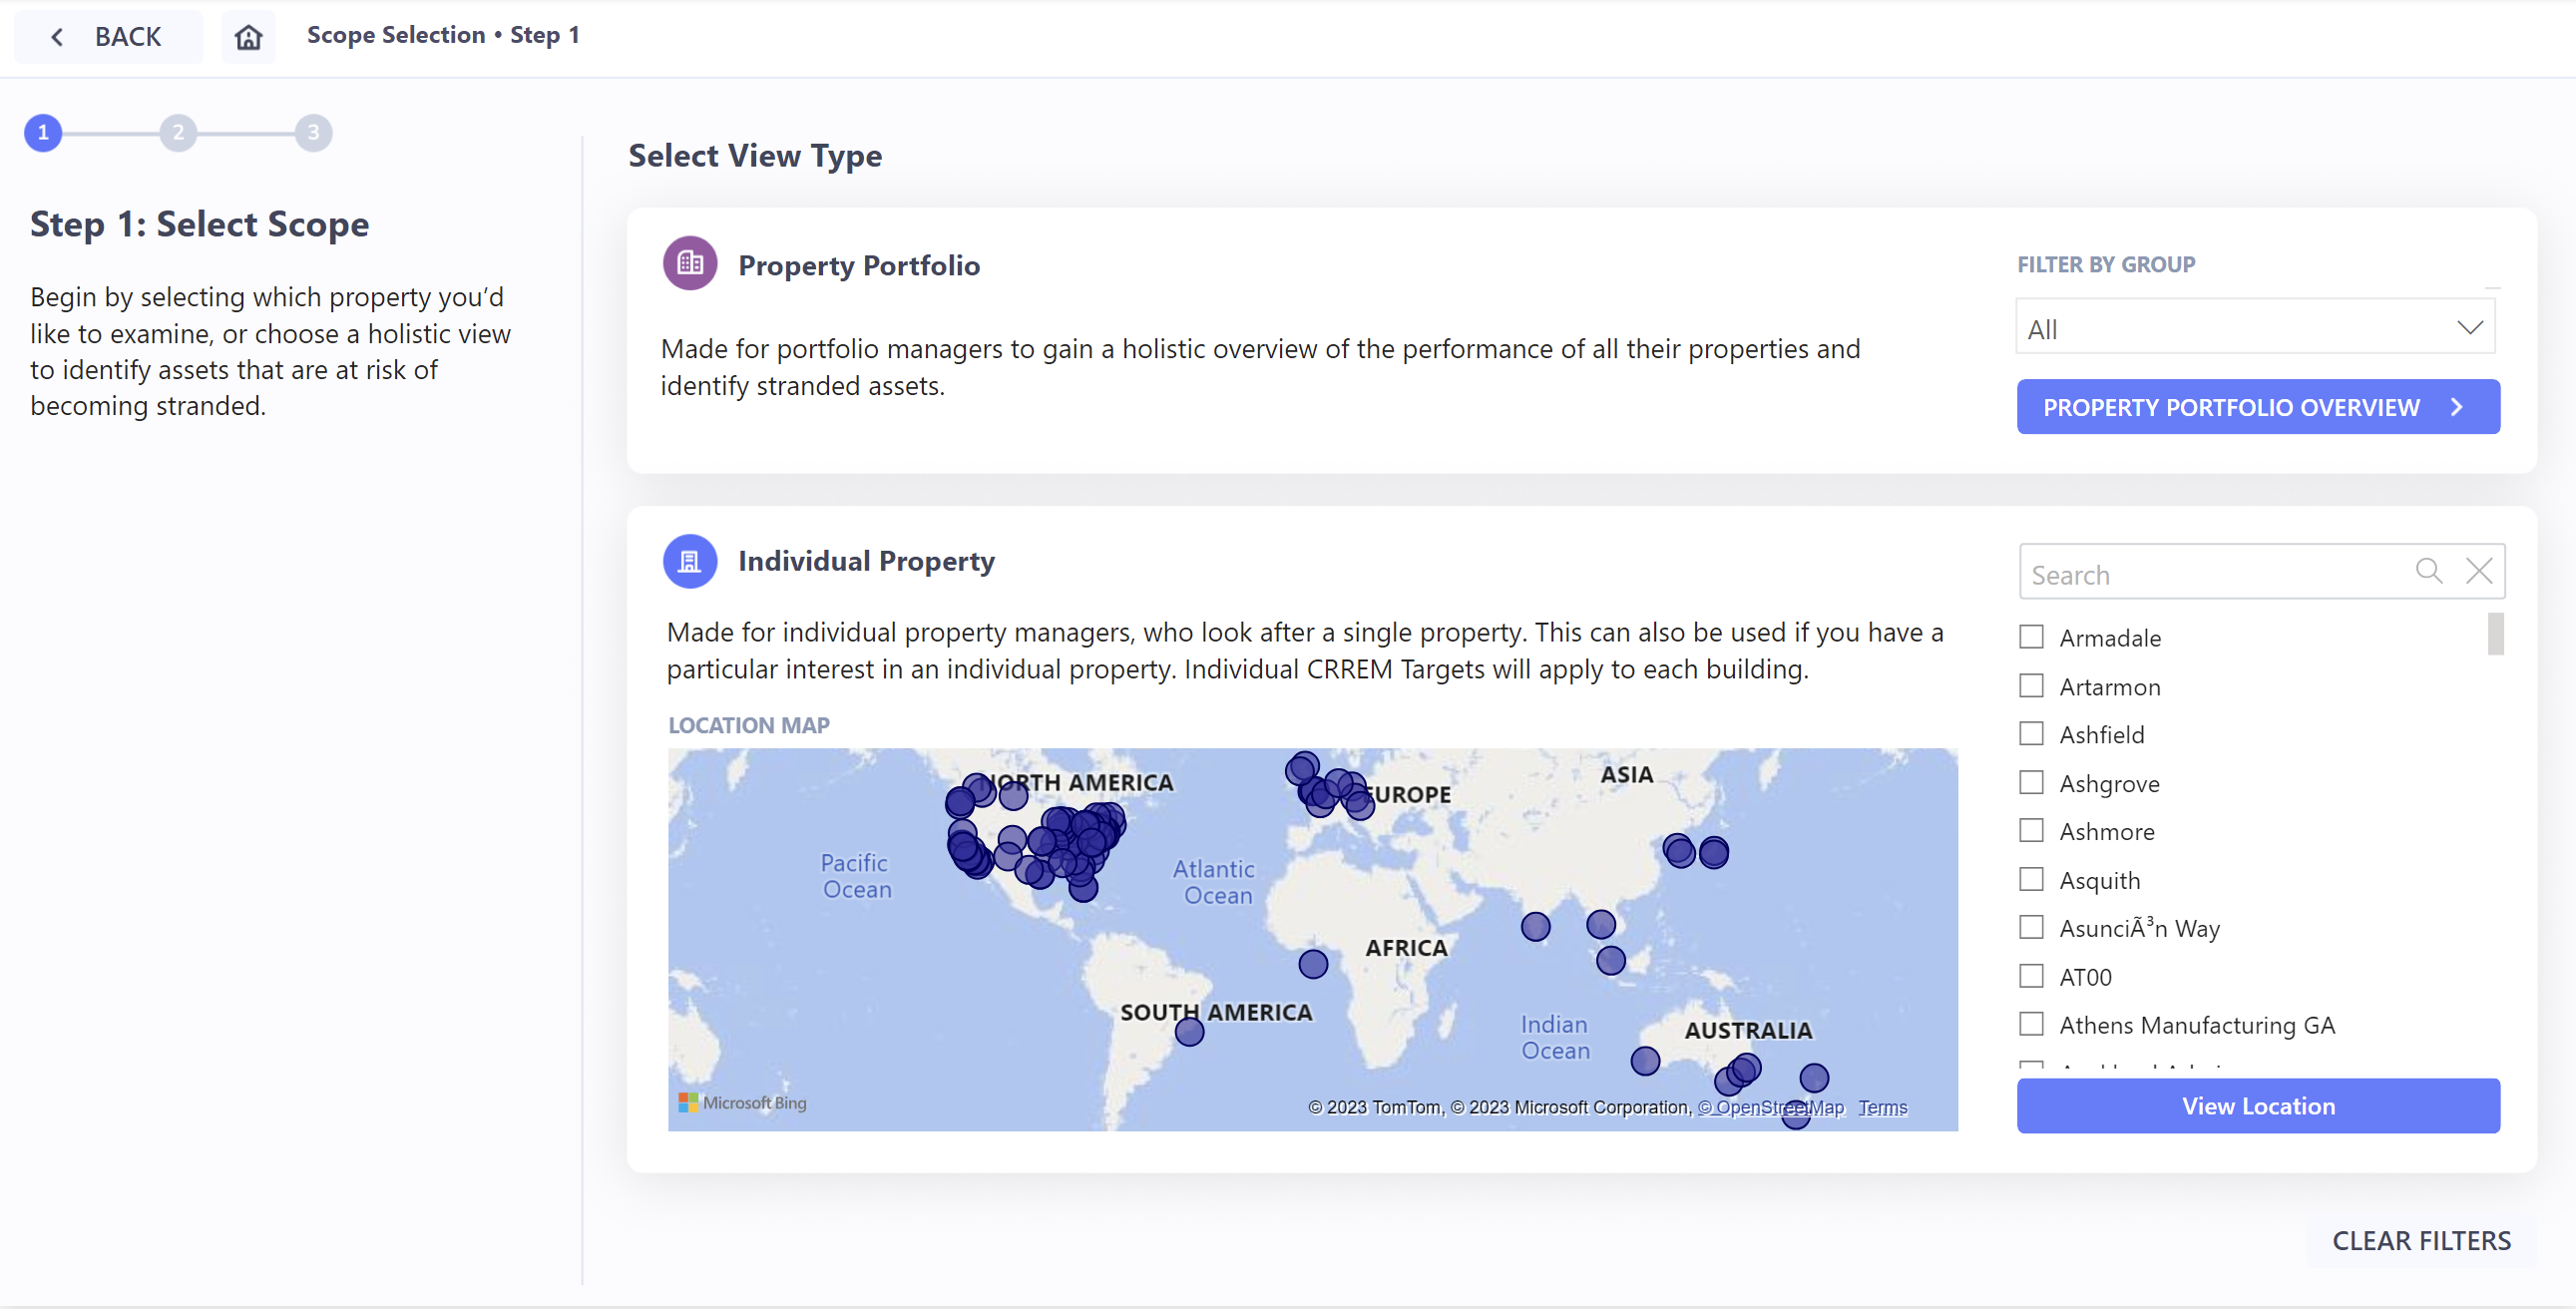
Step 1: Select your flow
This report can be viewed for either a single location or an entire portfolio. It's crucial to make the correct selection at the outset of your journey, as the model generated by the report will vary depending on the context you choose.
To opt for a portfolio-based model, utilize the dropdown menu to apply any group filters, and then proceed by clicking the "Property Portfolio Overview" button.
To opt for a location-based approach, locate your desired location in the list and select it by clicking on the location name. Then, continue by clicking the "View Location" button.
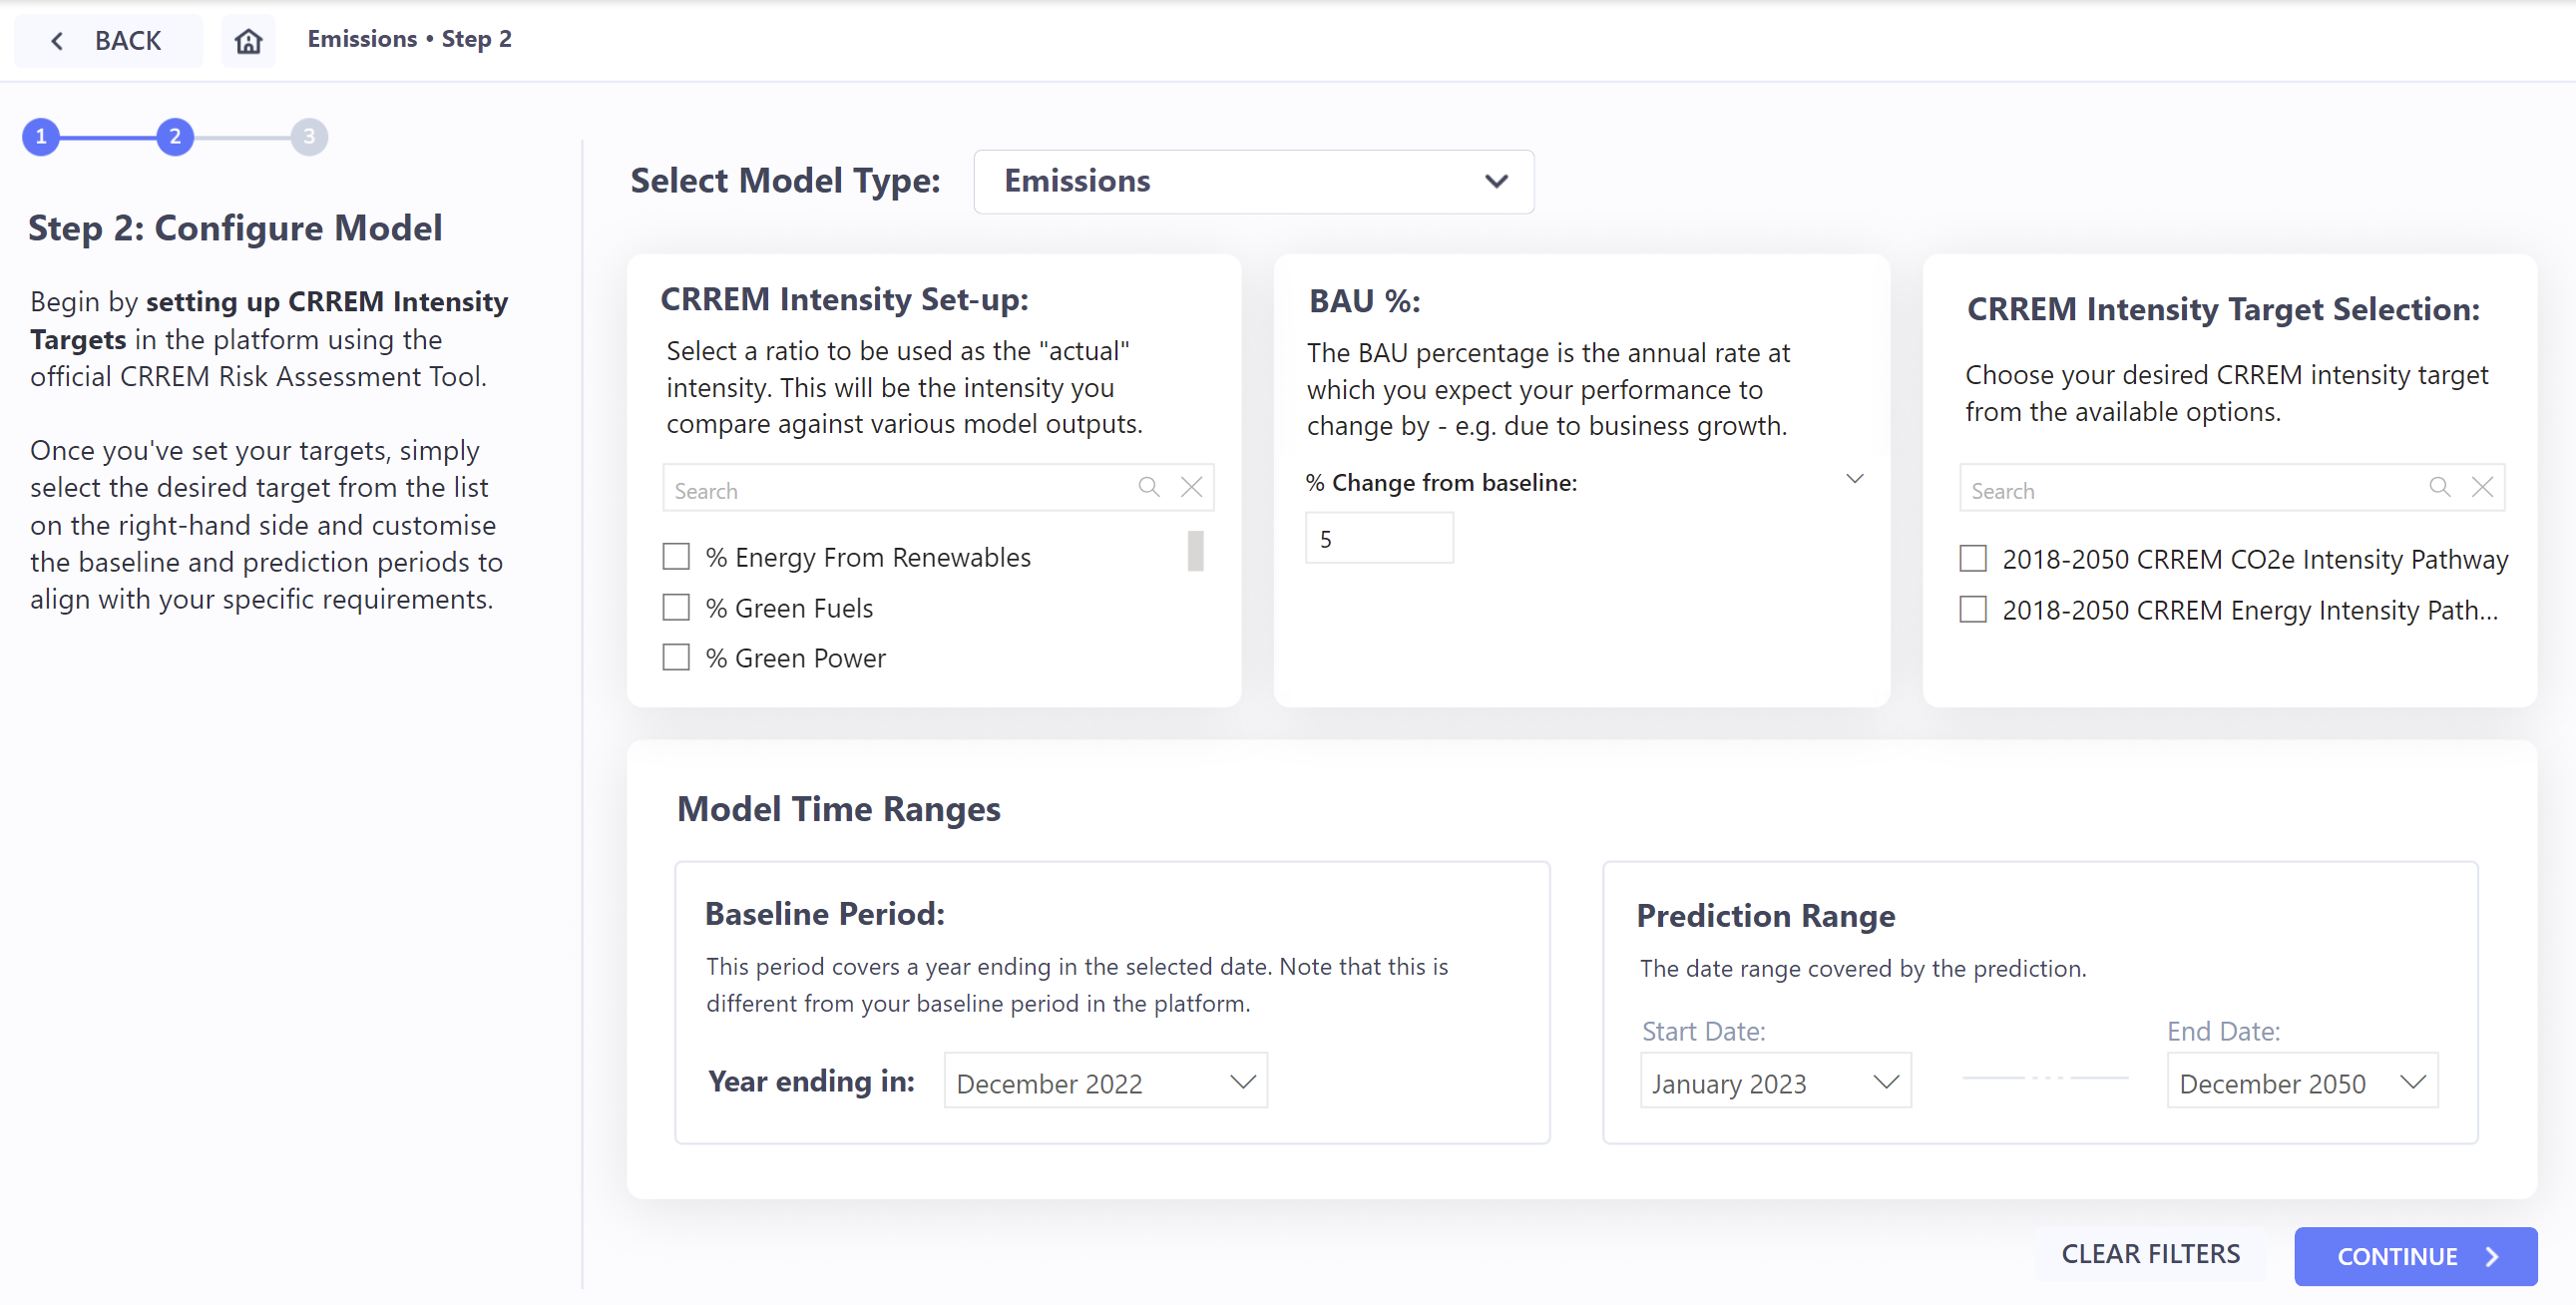
Step 2: Configure the Scenario
To begin forecasting, select your desired model type (Emissions or Energy) and set up the model variables. Each variable is defined in the table below:
Variable | Definition |
|---|---|
CRREM Intensity | A list of Rates/Ratios set up in the Envizi platform. Select the ratio that you use to determine your CRREM intensity. More information on CRREM intensities can be found at this link. New ratios will take 24 hours to populate to PowerReport. |
BAU % | An optional value to nominate the annual growth in Energy/Emissions due to regular activities. For example, this can be due to business growth or increase in utilization. |
CRREM Intensity Target | A list of all targets of the “CRREM Intensity Target” type in the Envizi platform. New targets will take 24 hours to populate to PowerReport. More information on intensity target set up in Envizi can be found in this article. |
Baseline Period | The 12-month period used to generate a prediction. We recommend using the latest period with minimal anomalies if possible. |
Prediction Range | The period across which a prediction will be generated. |
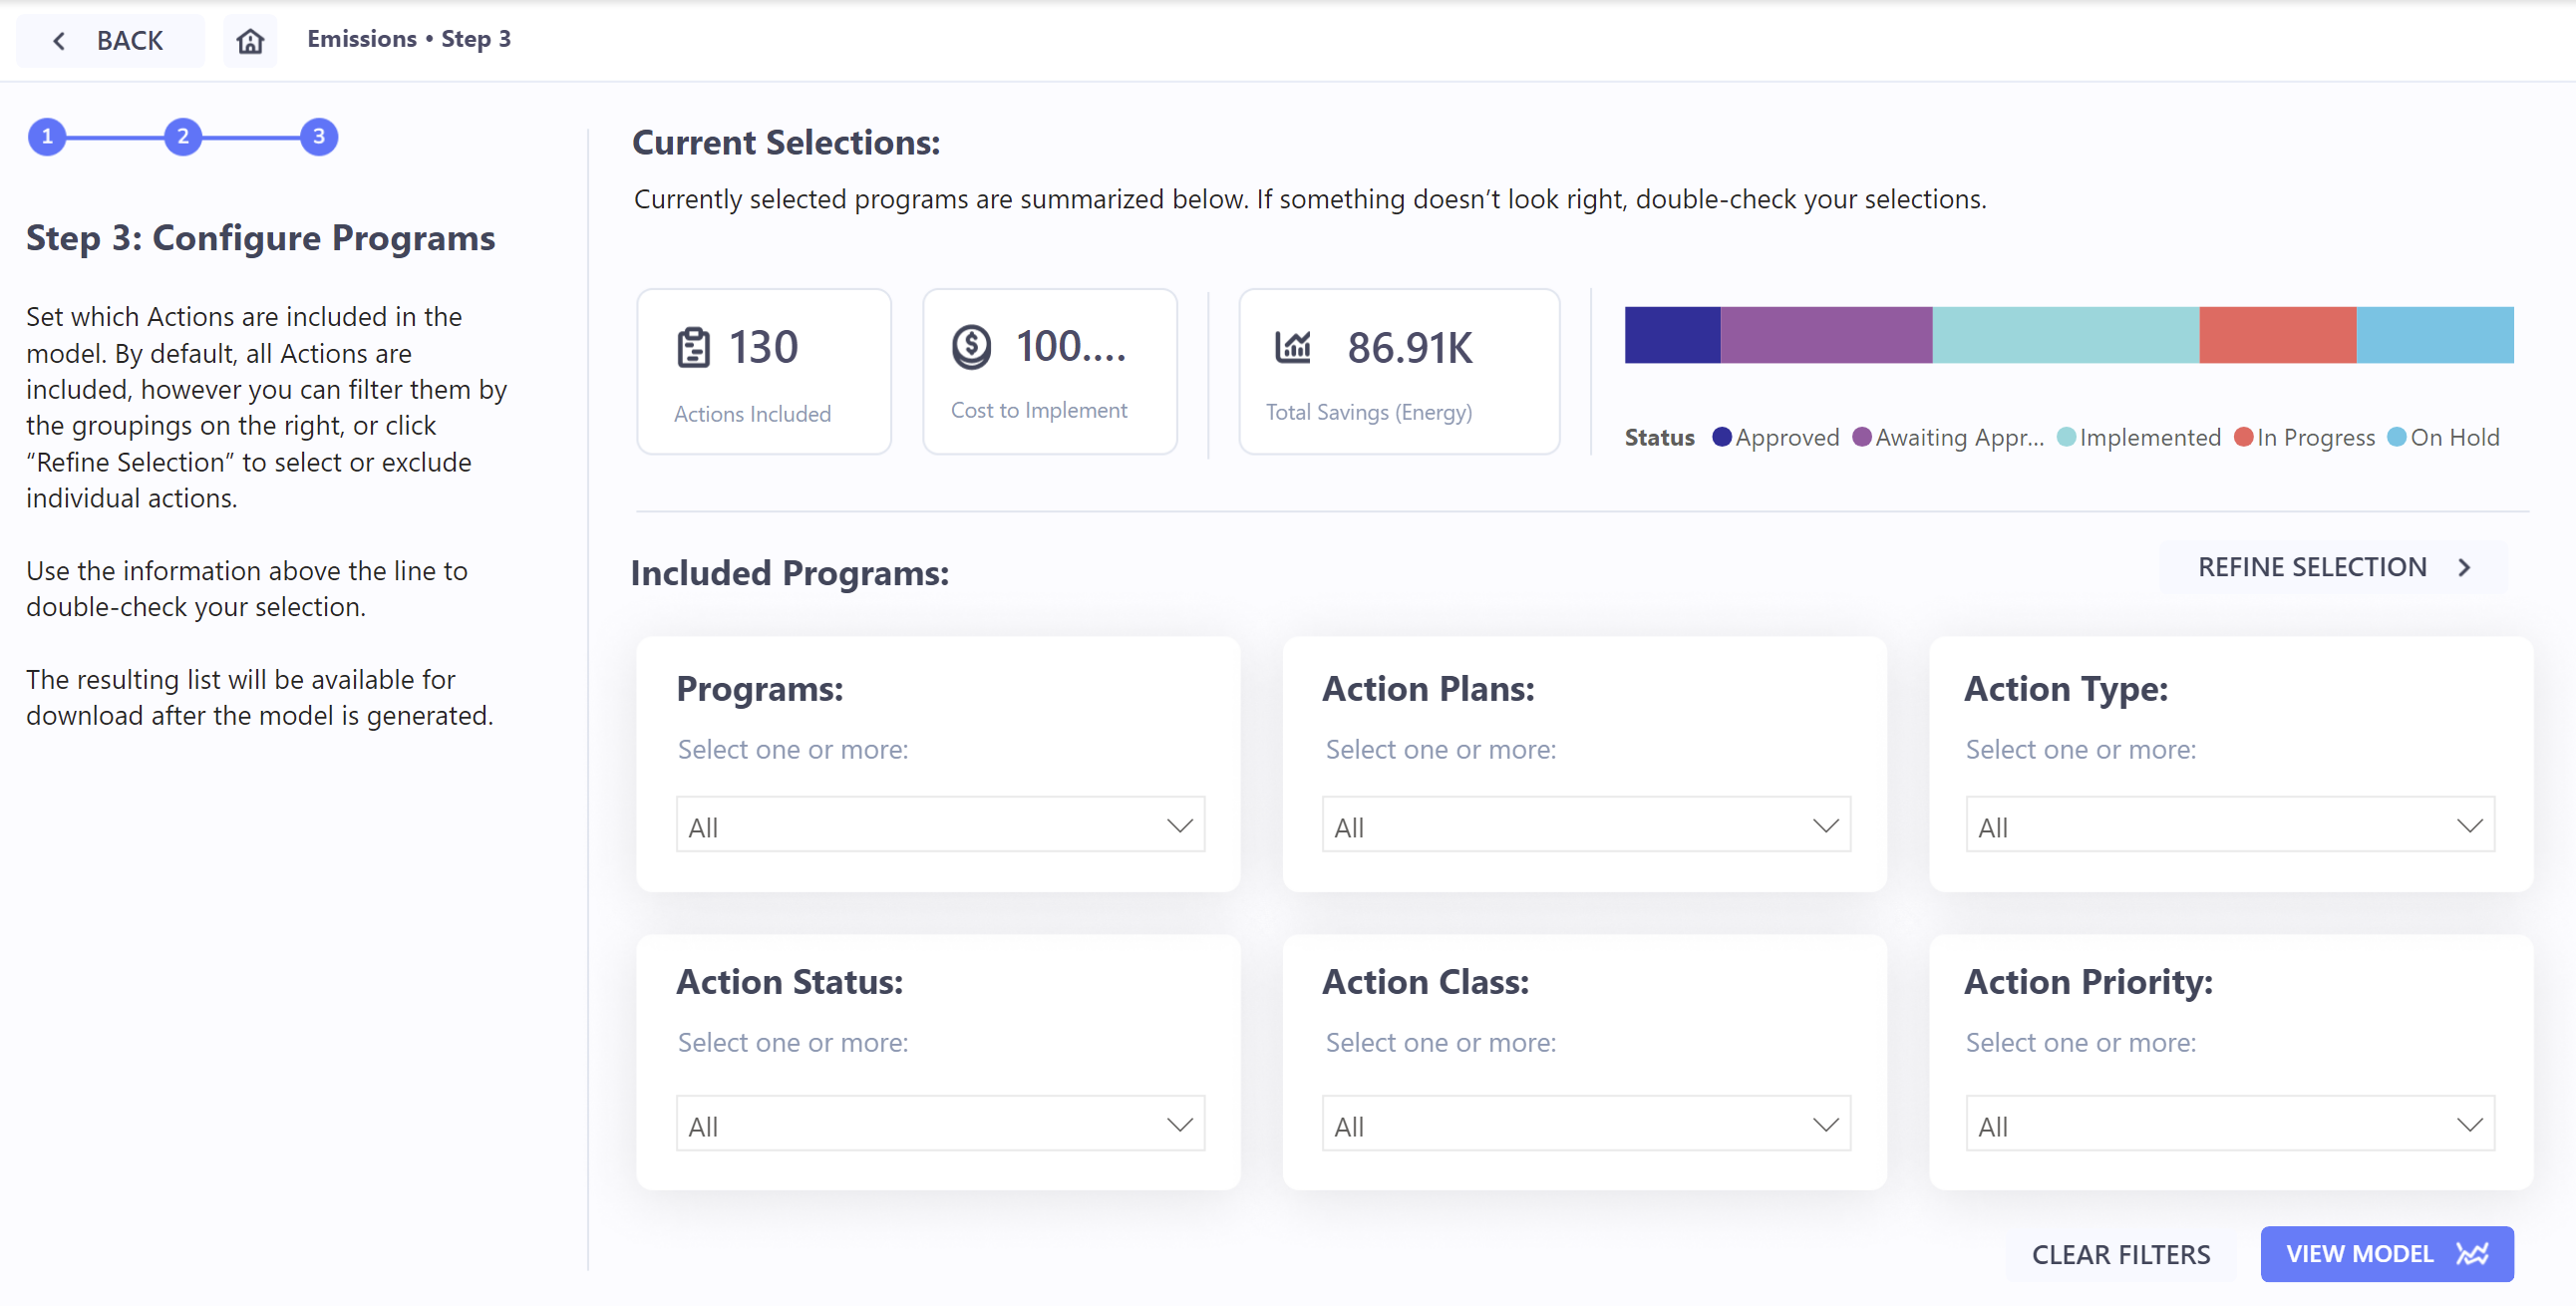
Step 3: Configure Programs
To refine your scenario, adjust program boundaries to include/exclude certain categories of programs from the prediction. If you wish to refine your selections further by controlling the individual programs, select the “refine Selection” option.
Final Model
Depending on earlier selections, the report will generate one of two models.
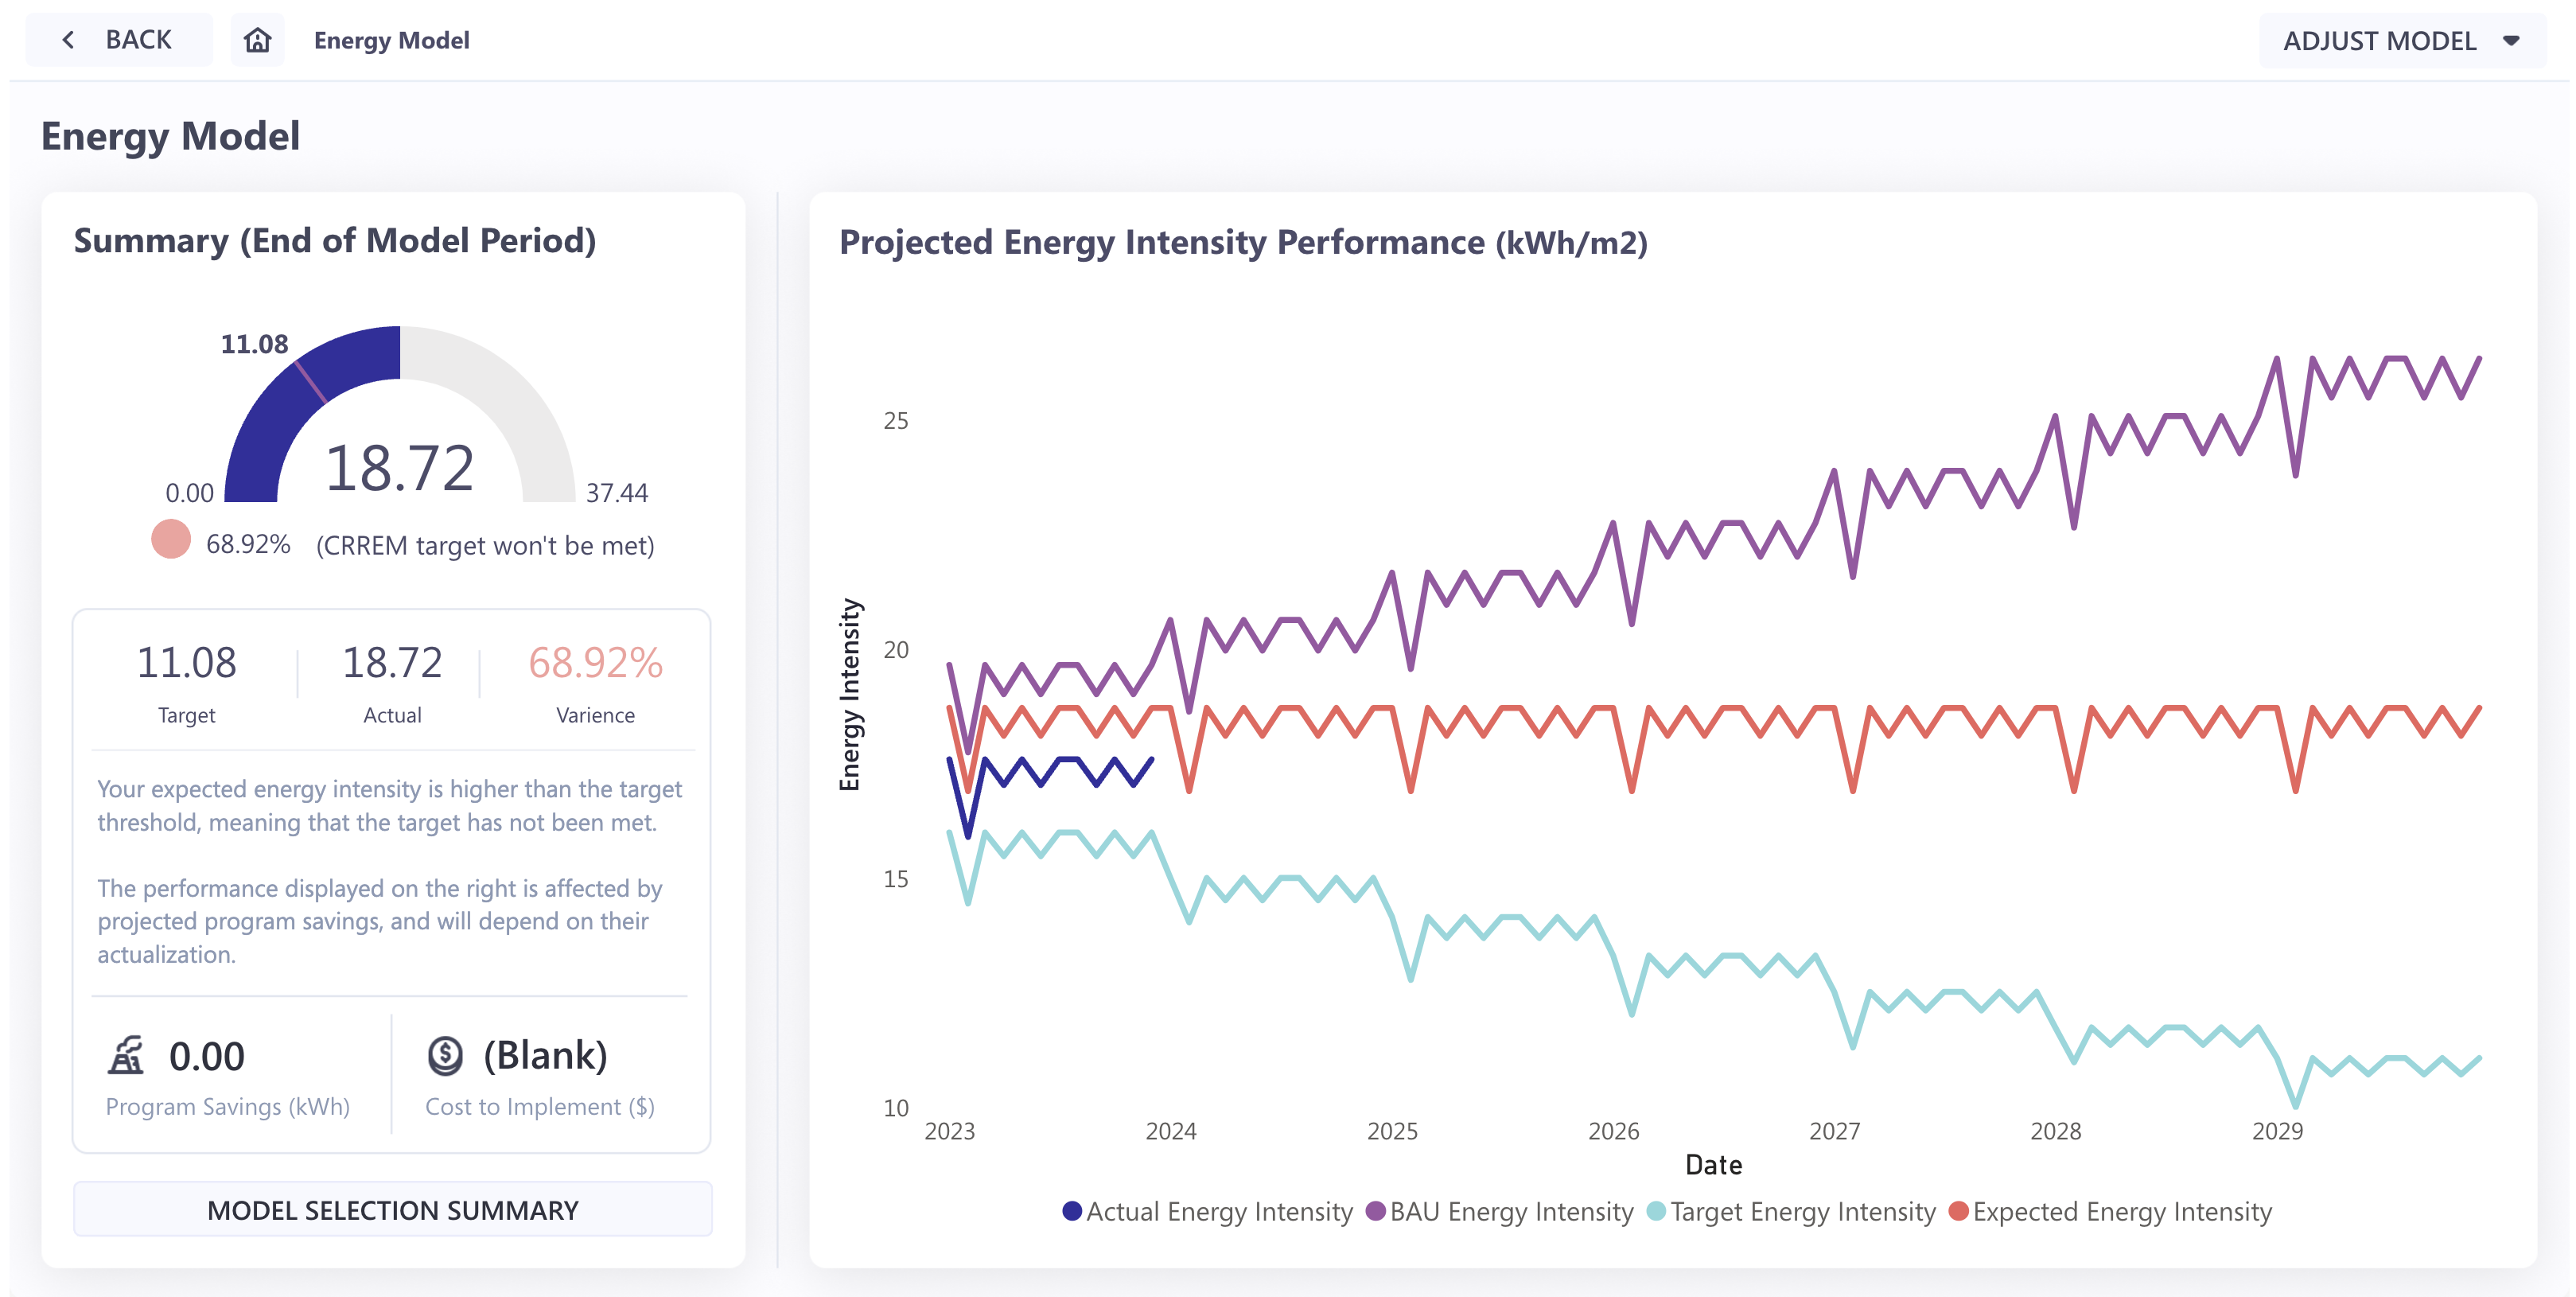
The location-based model will draw a distinct pathway of Energy/Emissions figures for 4 scenarios:
Actual Emissions/Energy: The actual intensity recorded for the prediction period. No factors or calculations affect this line.
BAU Emissions/Energy: Using the baseline period, the line generates a predicted intensity for the prediction period, incremented by the set BAU %.
Target Emissions/Energy: The selected intensity target values.
Expected Emissions/Energy: Using the baseline period, the line generates a predicted intensity for the prediction period, incremented by the set BAU %. The calculation then applies any program savings affecting the period based on earlier program selections. The resulting line is a prediction of Emissions/Energy values in the event that all program savings are realised.
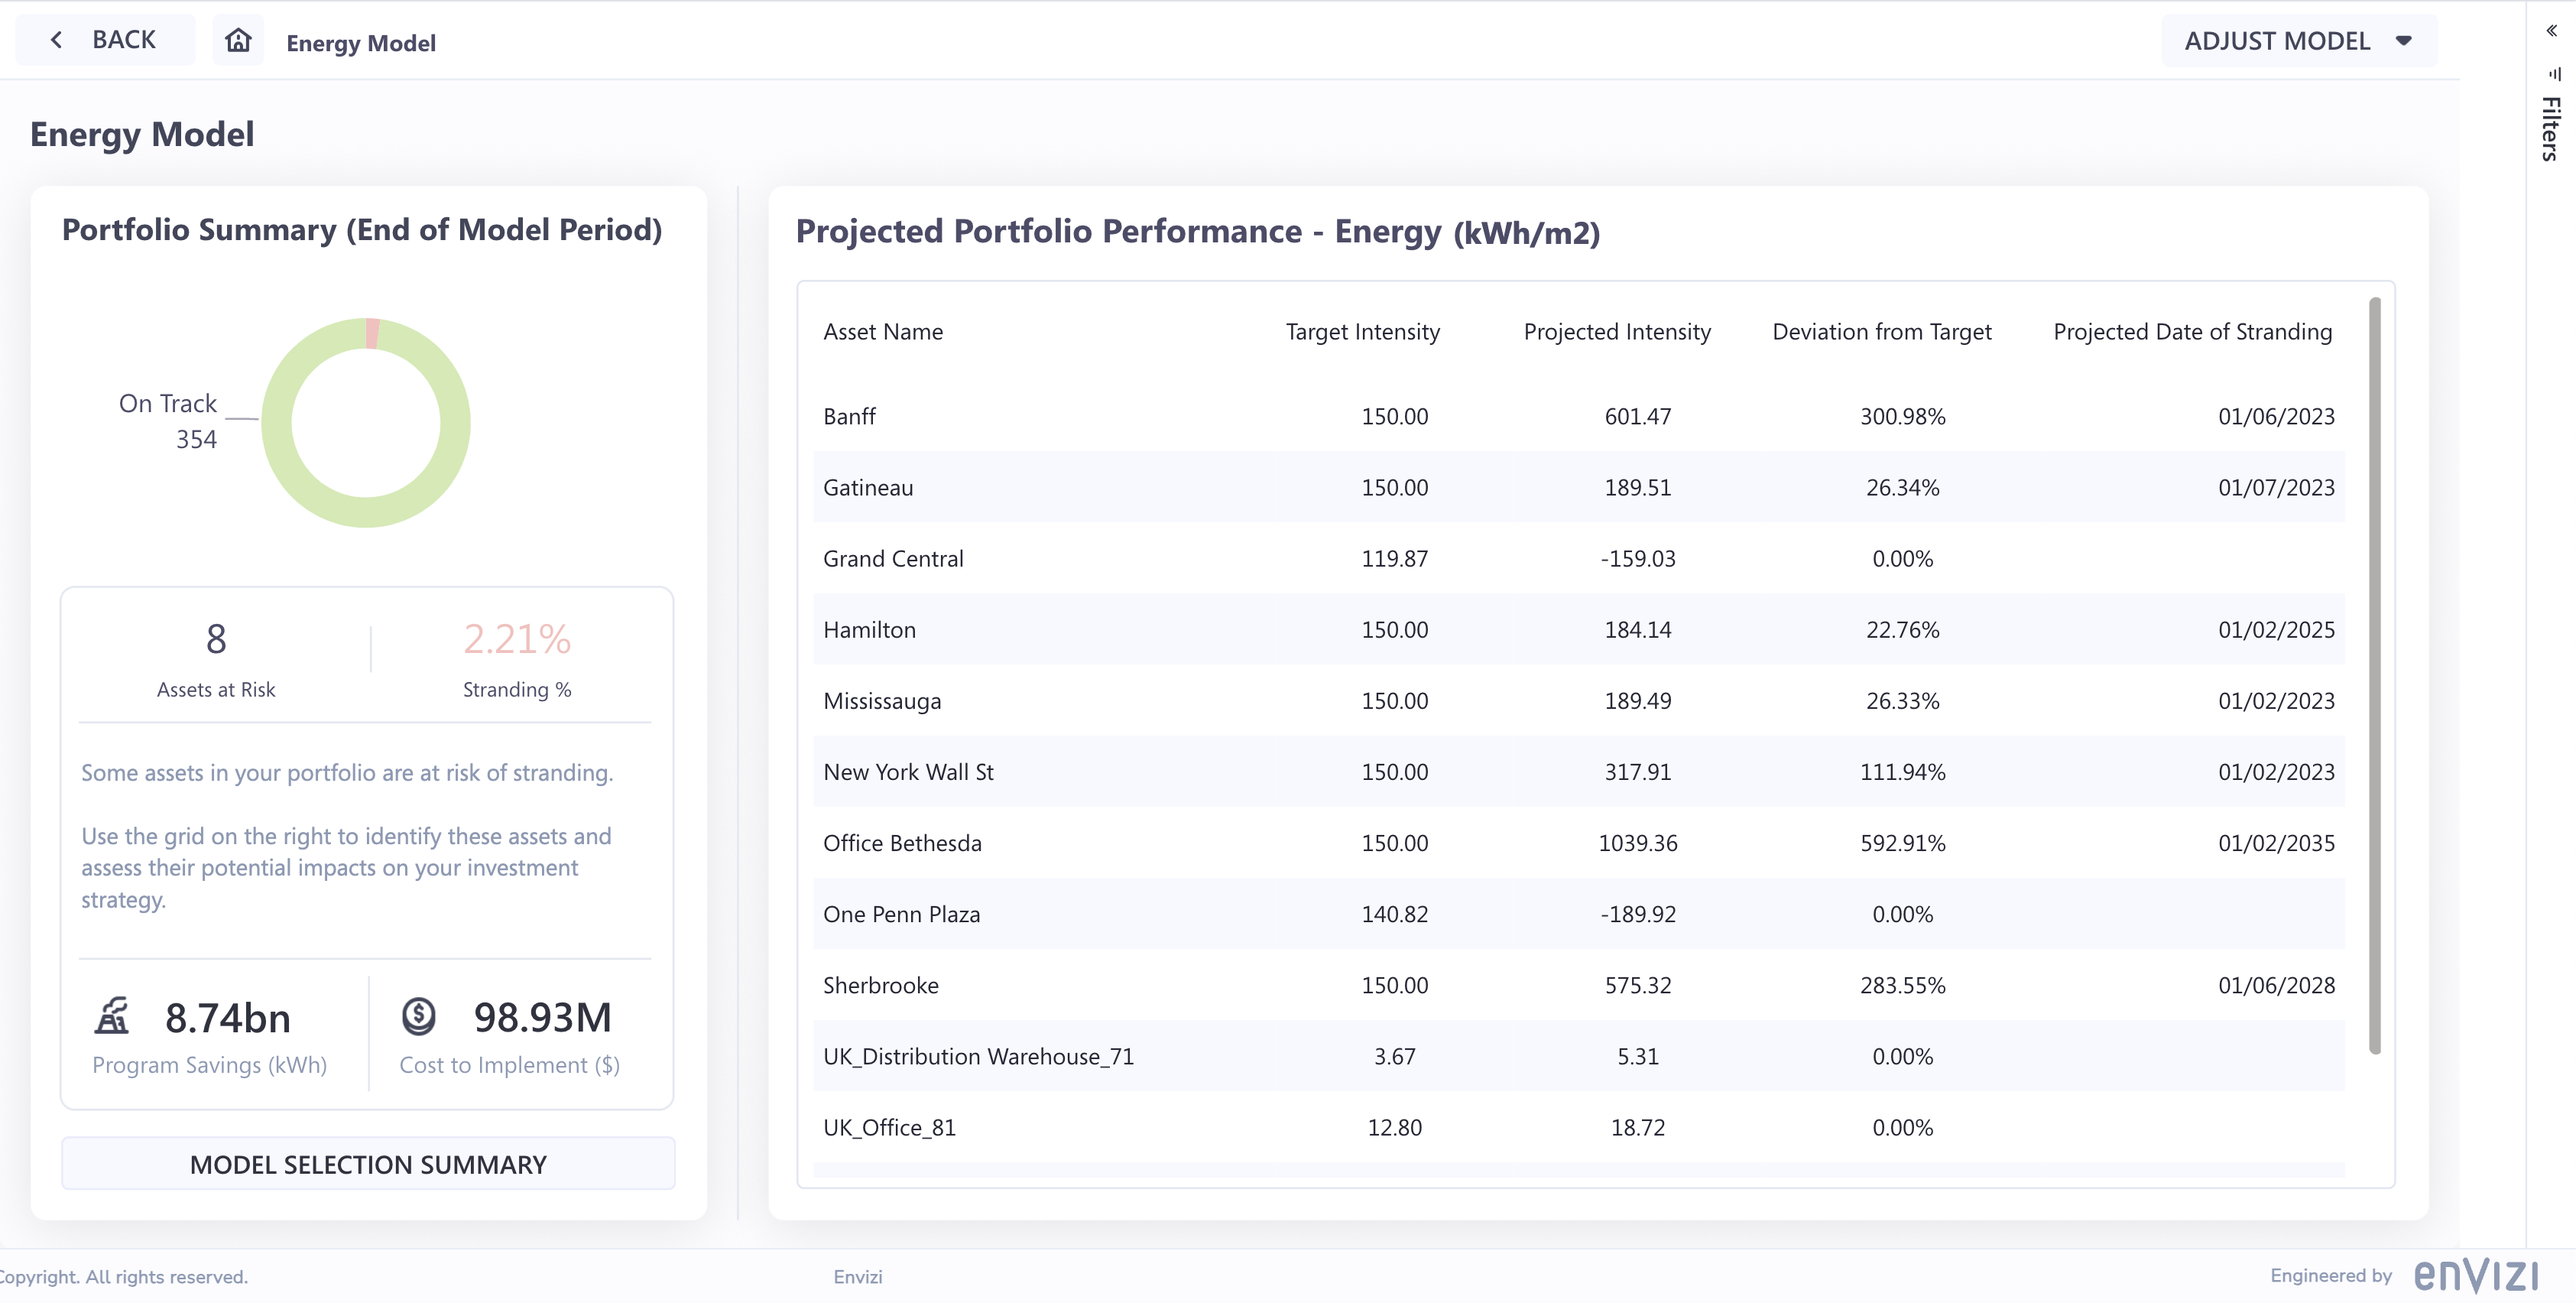
The portfolio-based model generates the above model figures for all locations that fall under your portfolio selection and displays an overview of these figures in tabular format: