UDMA Normalization
Normalization based on weather metrics allows user to compare actual consumption with its normalized profile, which delivers benefit in terms of potential financial savings and operational efficiency. As part of the Utility Data Management + Analytics module, you are able to perform regression analysis on utility consumption, view and compare actual consumption with its expected normalized profile, for a particular account, meter or location. The variances between the actual and normalized are calculated and ranked upon on to give you a holistic view of the best and worst performers.
Regression Analysis Dashboard
The regression analysis tool in Envizi is used to carry out baseline regression analysis of consumption against heating and cooling loads or against other performance metrics that are predictive of consumption. The regression analysis tool helps you identify correlation between consumption and these predictive variables that can be used to predict consumption.
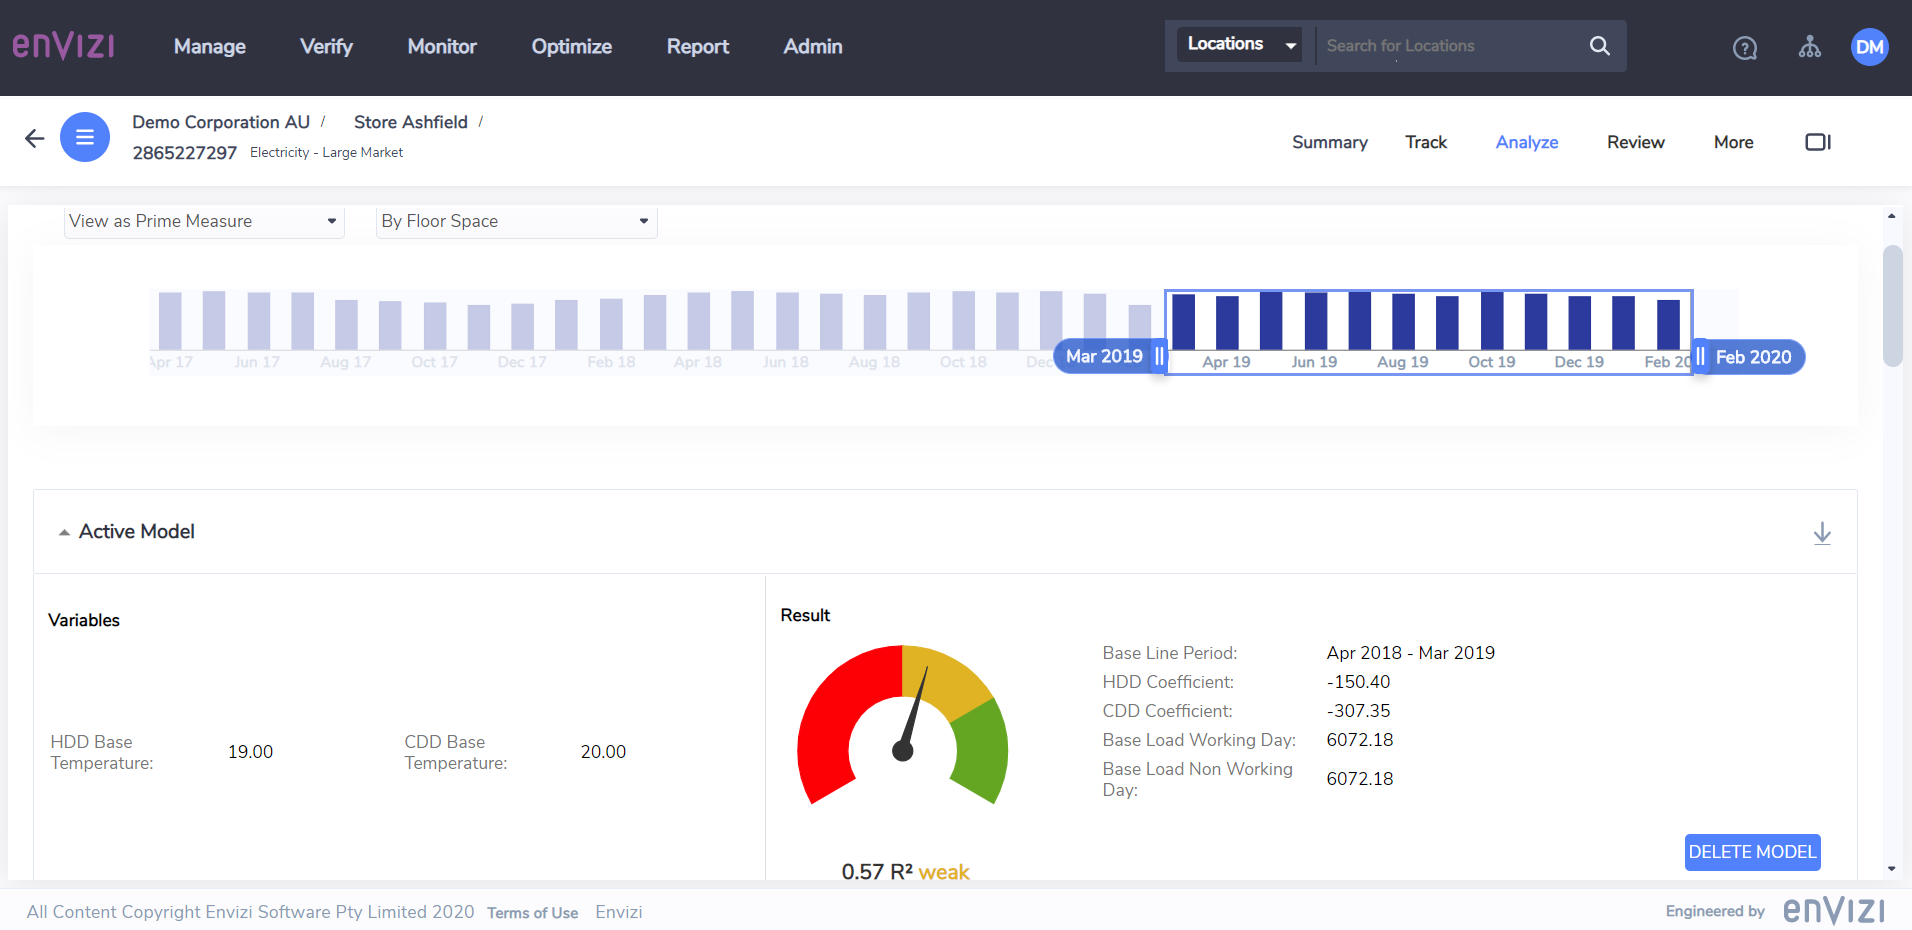
The Regression Analysis dashboard is available under the Analyze sub-menu of an Account or Meter.
To use the dashboard, at least 12 months of historical data must be available and the Location must be linked to an appropriate weather station for HDD/CDD values to be calculated.
Bulk Regression Analysis
The 'Bulk Regression Modeller - Accounts' report allows you to perform bulk regression analysis on weather metrics for selected range of Accounts, based on a few pre-defined parameters. The regression analysis in the report works the same way as the incumbent Regression Analysis dashboard on Account, with the added advantage of running for bulk.
The report can be run in two modes - "View Only" mode and "Commit To Save" mode. In 'Commit To Save' mode, regression results for applicable Accounts will be saved into the platform together with relevant HDD and CDD metric changes required for weather normalization reporting. The report can only be run as an email attachment in CSV format in both modes.
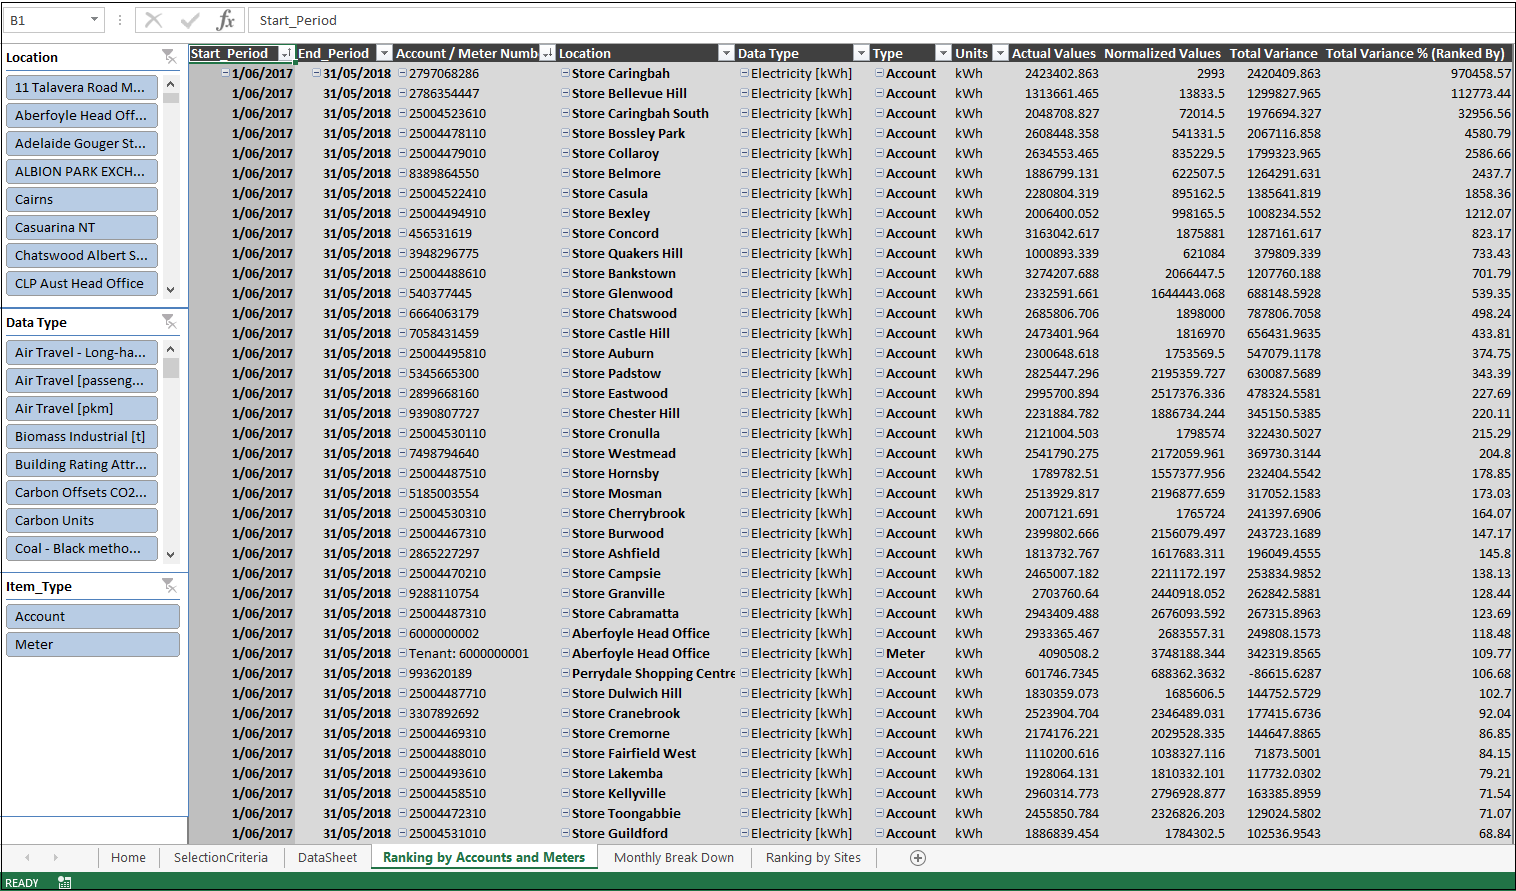
Ranking Actual vs Normalized (Excel Reporting Template)
The Ranking Actual vs Normalized ERT provides a comprehensive view of actual consumption and its normalized profile values. Accounts and Meters are ranked based on their variances to normalized values. Site-level comparison is also available by examining the aggregated values of all Accounts and Meters within the site and comparing it with other sites.
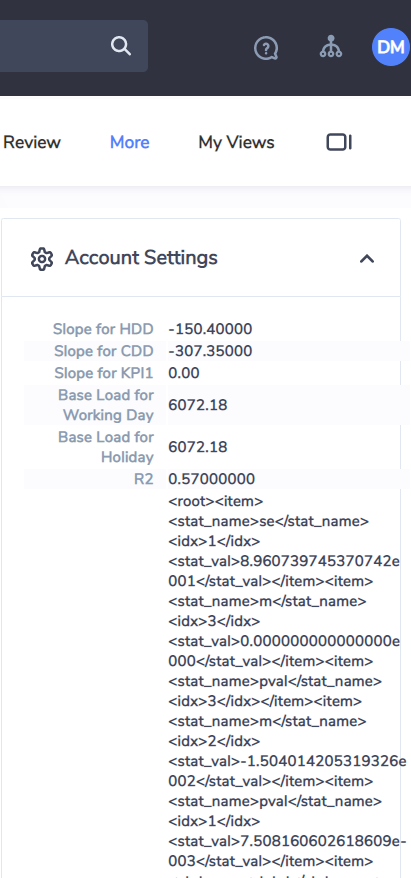
Prerequisite: to use the ERT, regression analysis must have been performed on applicable Accounts or Meters, either through Envizi's Regression Analysis tool, or modelled externally. In either case, the derived regression coefficients must have been saved into Envizi as Account or Meter attributes:-
Slope for HDD
Slope for CDD
Base Load for Working Day
Base Load for Holiday
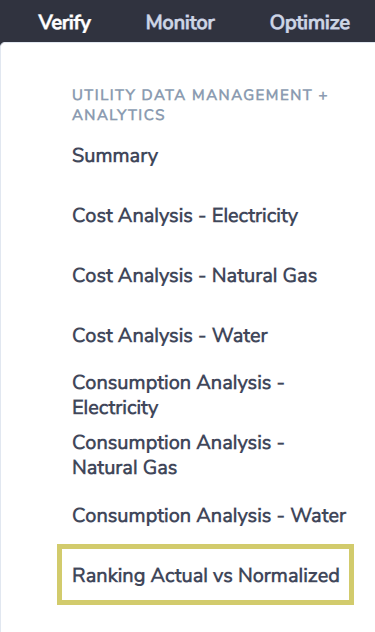
Access the Ranking Actual vs Normalized ERT from Verify → Utility Analytics → Ranking Actual vs Normalized.
There are three reporting tabs in the report:-
Ranking by Accounts and Meters
Monthly Break Down - this also includes HDD, CDD and Slope (coefficients) etc. used in generating the Normalized values
Ranking by Sites
These are the items to be noted for the report:-
By default the ranking is based on the Variance %
The DataSheet tab contains the raw data extract that breaks down into monthly blocks for each Account or Meter
If the Account or Meter does not have any normalization coefficients saved in the system then the Normalized Values will be reported as 0 in the report
The ERT is also available on the Group and Location level:-
Group → Consumption → Ranking Actual vs Normalized
Location → Analyze → Ranking Actual vs Normalized
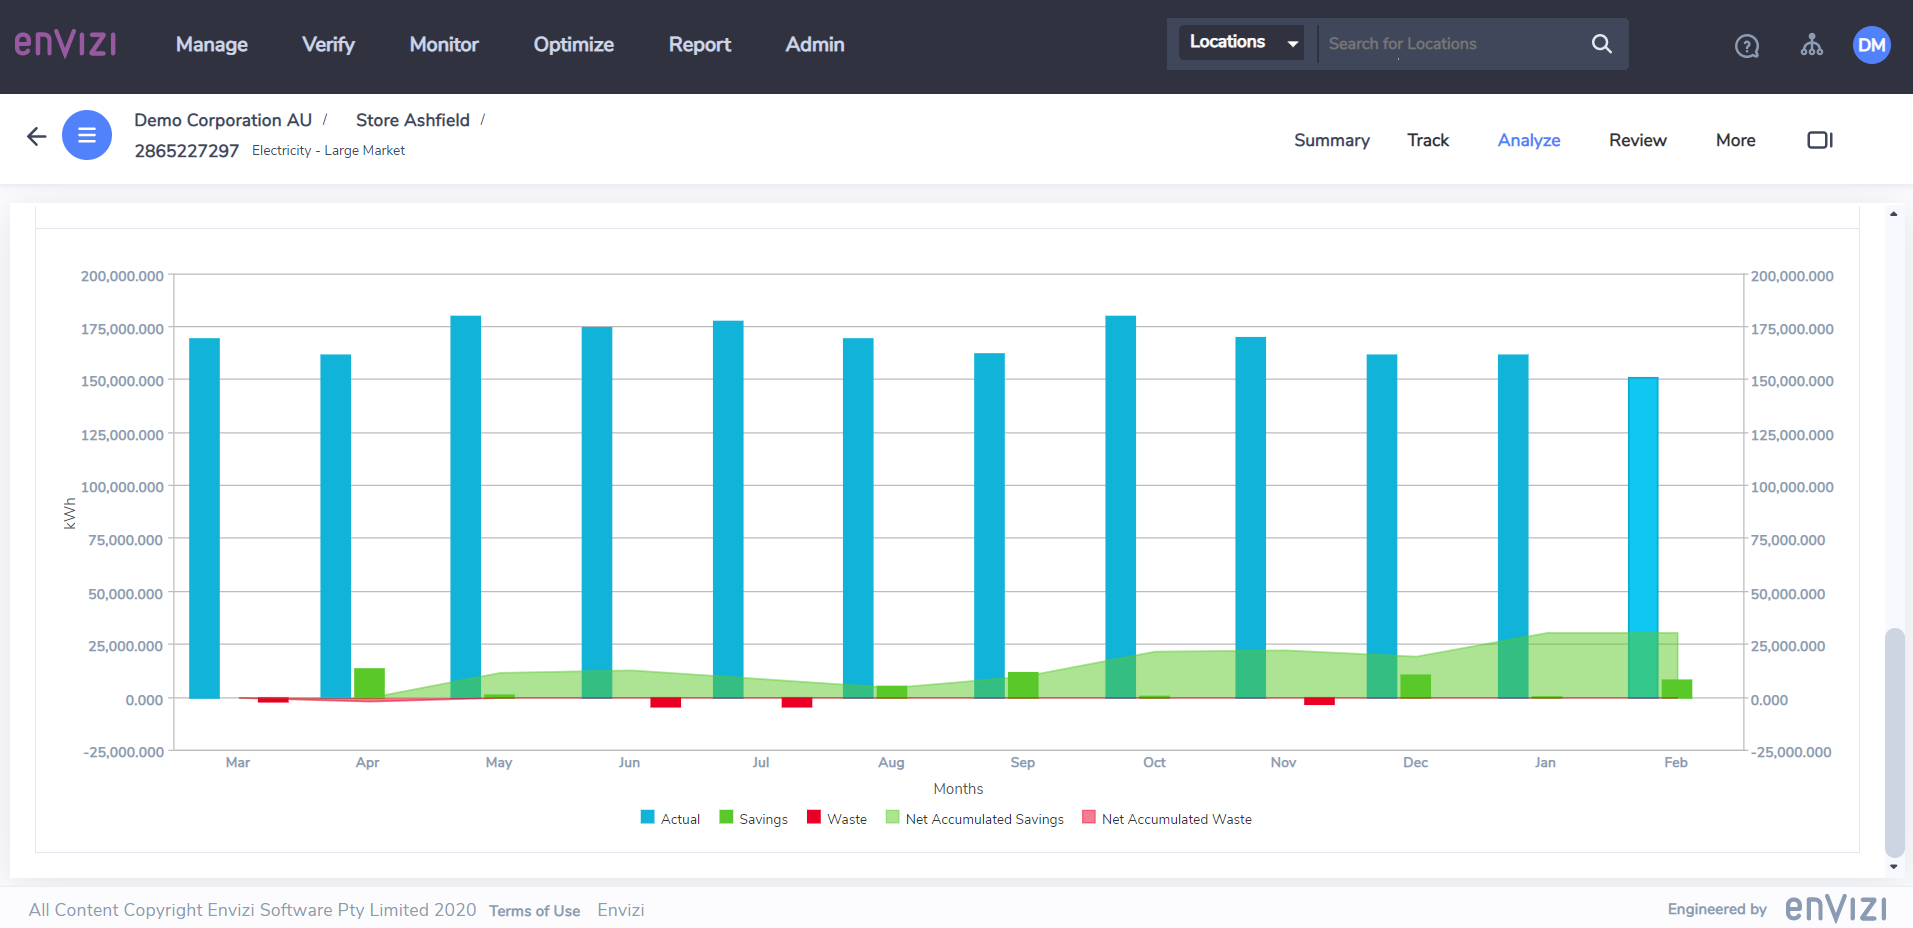
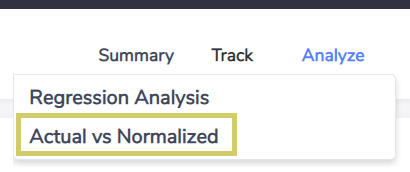
Actual vs Normalized Dashboard
The Actual vs Normalized dashboard allows you to compare actual and normalized values visually in dashboard charts. The dashboard also calculates savings and waste in relation to the normalized values to help you determine the account or meter's energy performance in the selected time period.
This dashboard is available under the Analyze sub-menu of an Account or Meter.
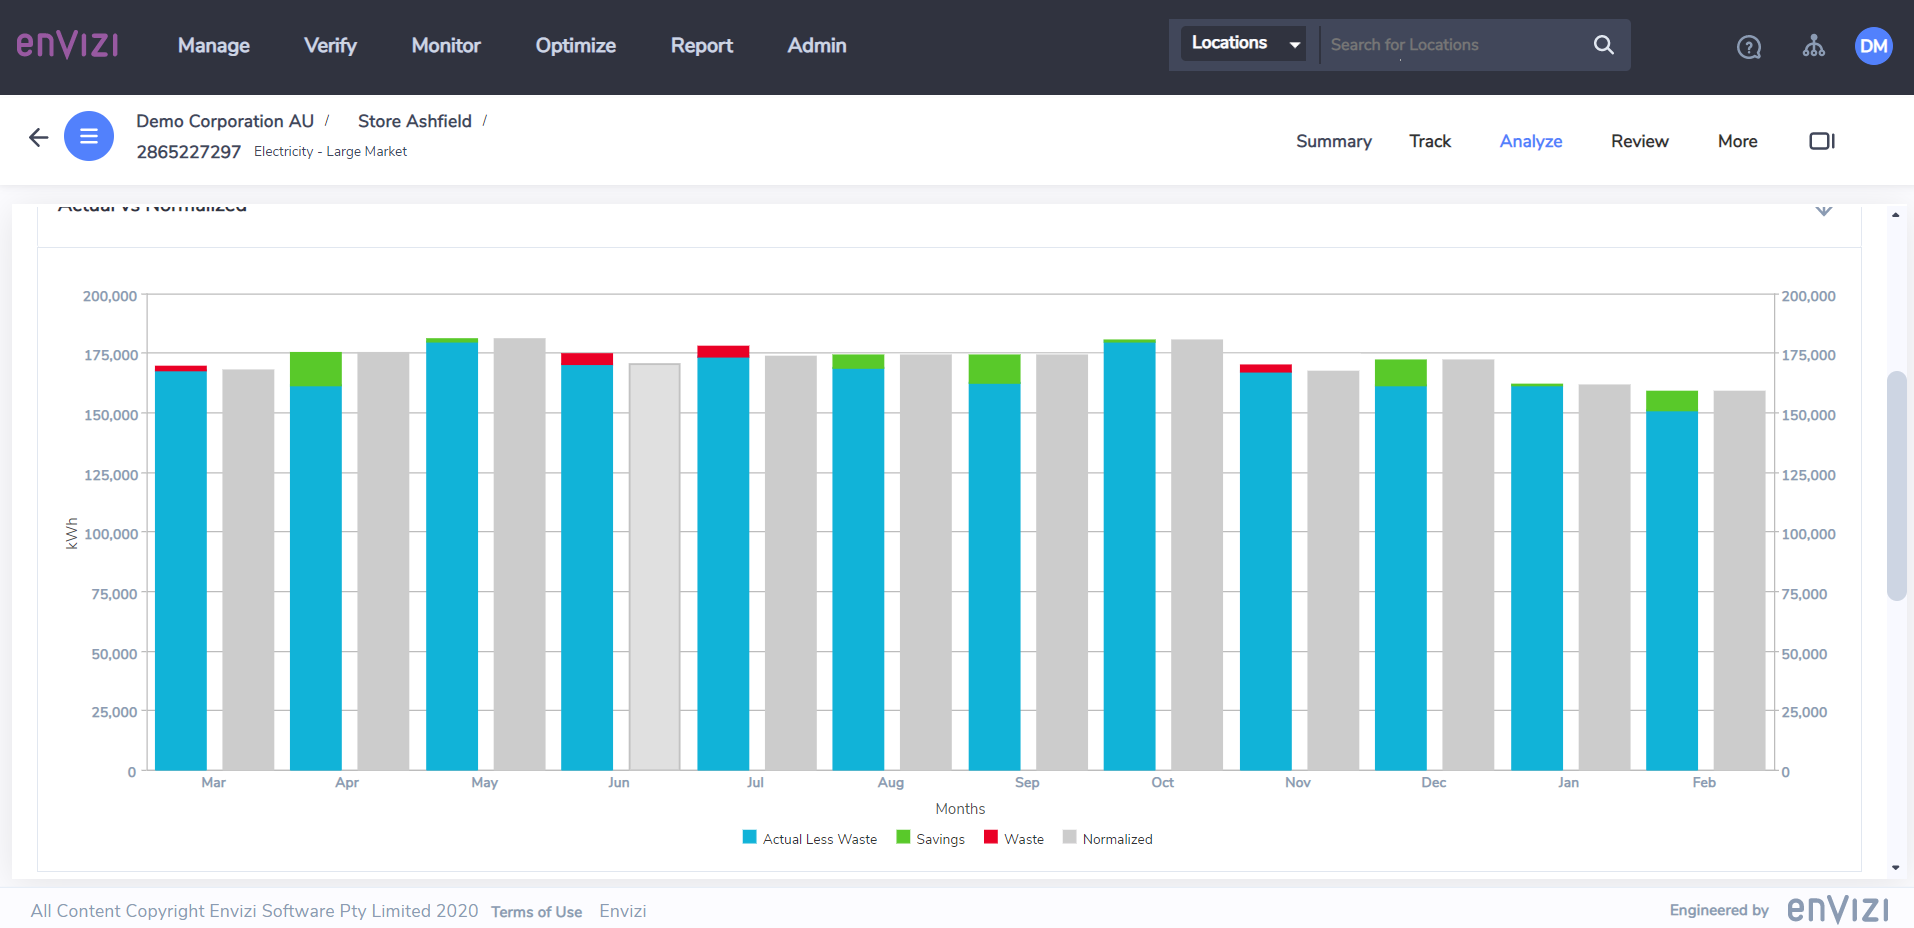
Similar to the ERT, the pre-requisite to use the dashboard is that regression coefficients must be saved into Envizi as Account or Meter attributes.
The Net Accumulated Saving and Net Accumulated Waste shows an overall performance of the Account or Meter over the selected time period.