
Scope 3 Emissions Analysis - Data Health
The Data Health Analysis shows how much of your collected data is actual, estimated or accrued over time.
In Envizi, all entered data is diligently tracked and categorized as either actual, estimated, or accrued. For more in-depth information regarding this topic, you can refer to the following article: Link to Knowledge Base Article on Accruals.
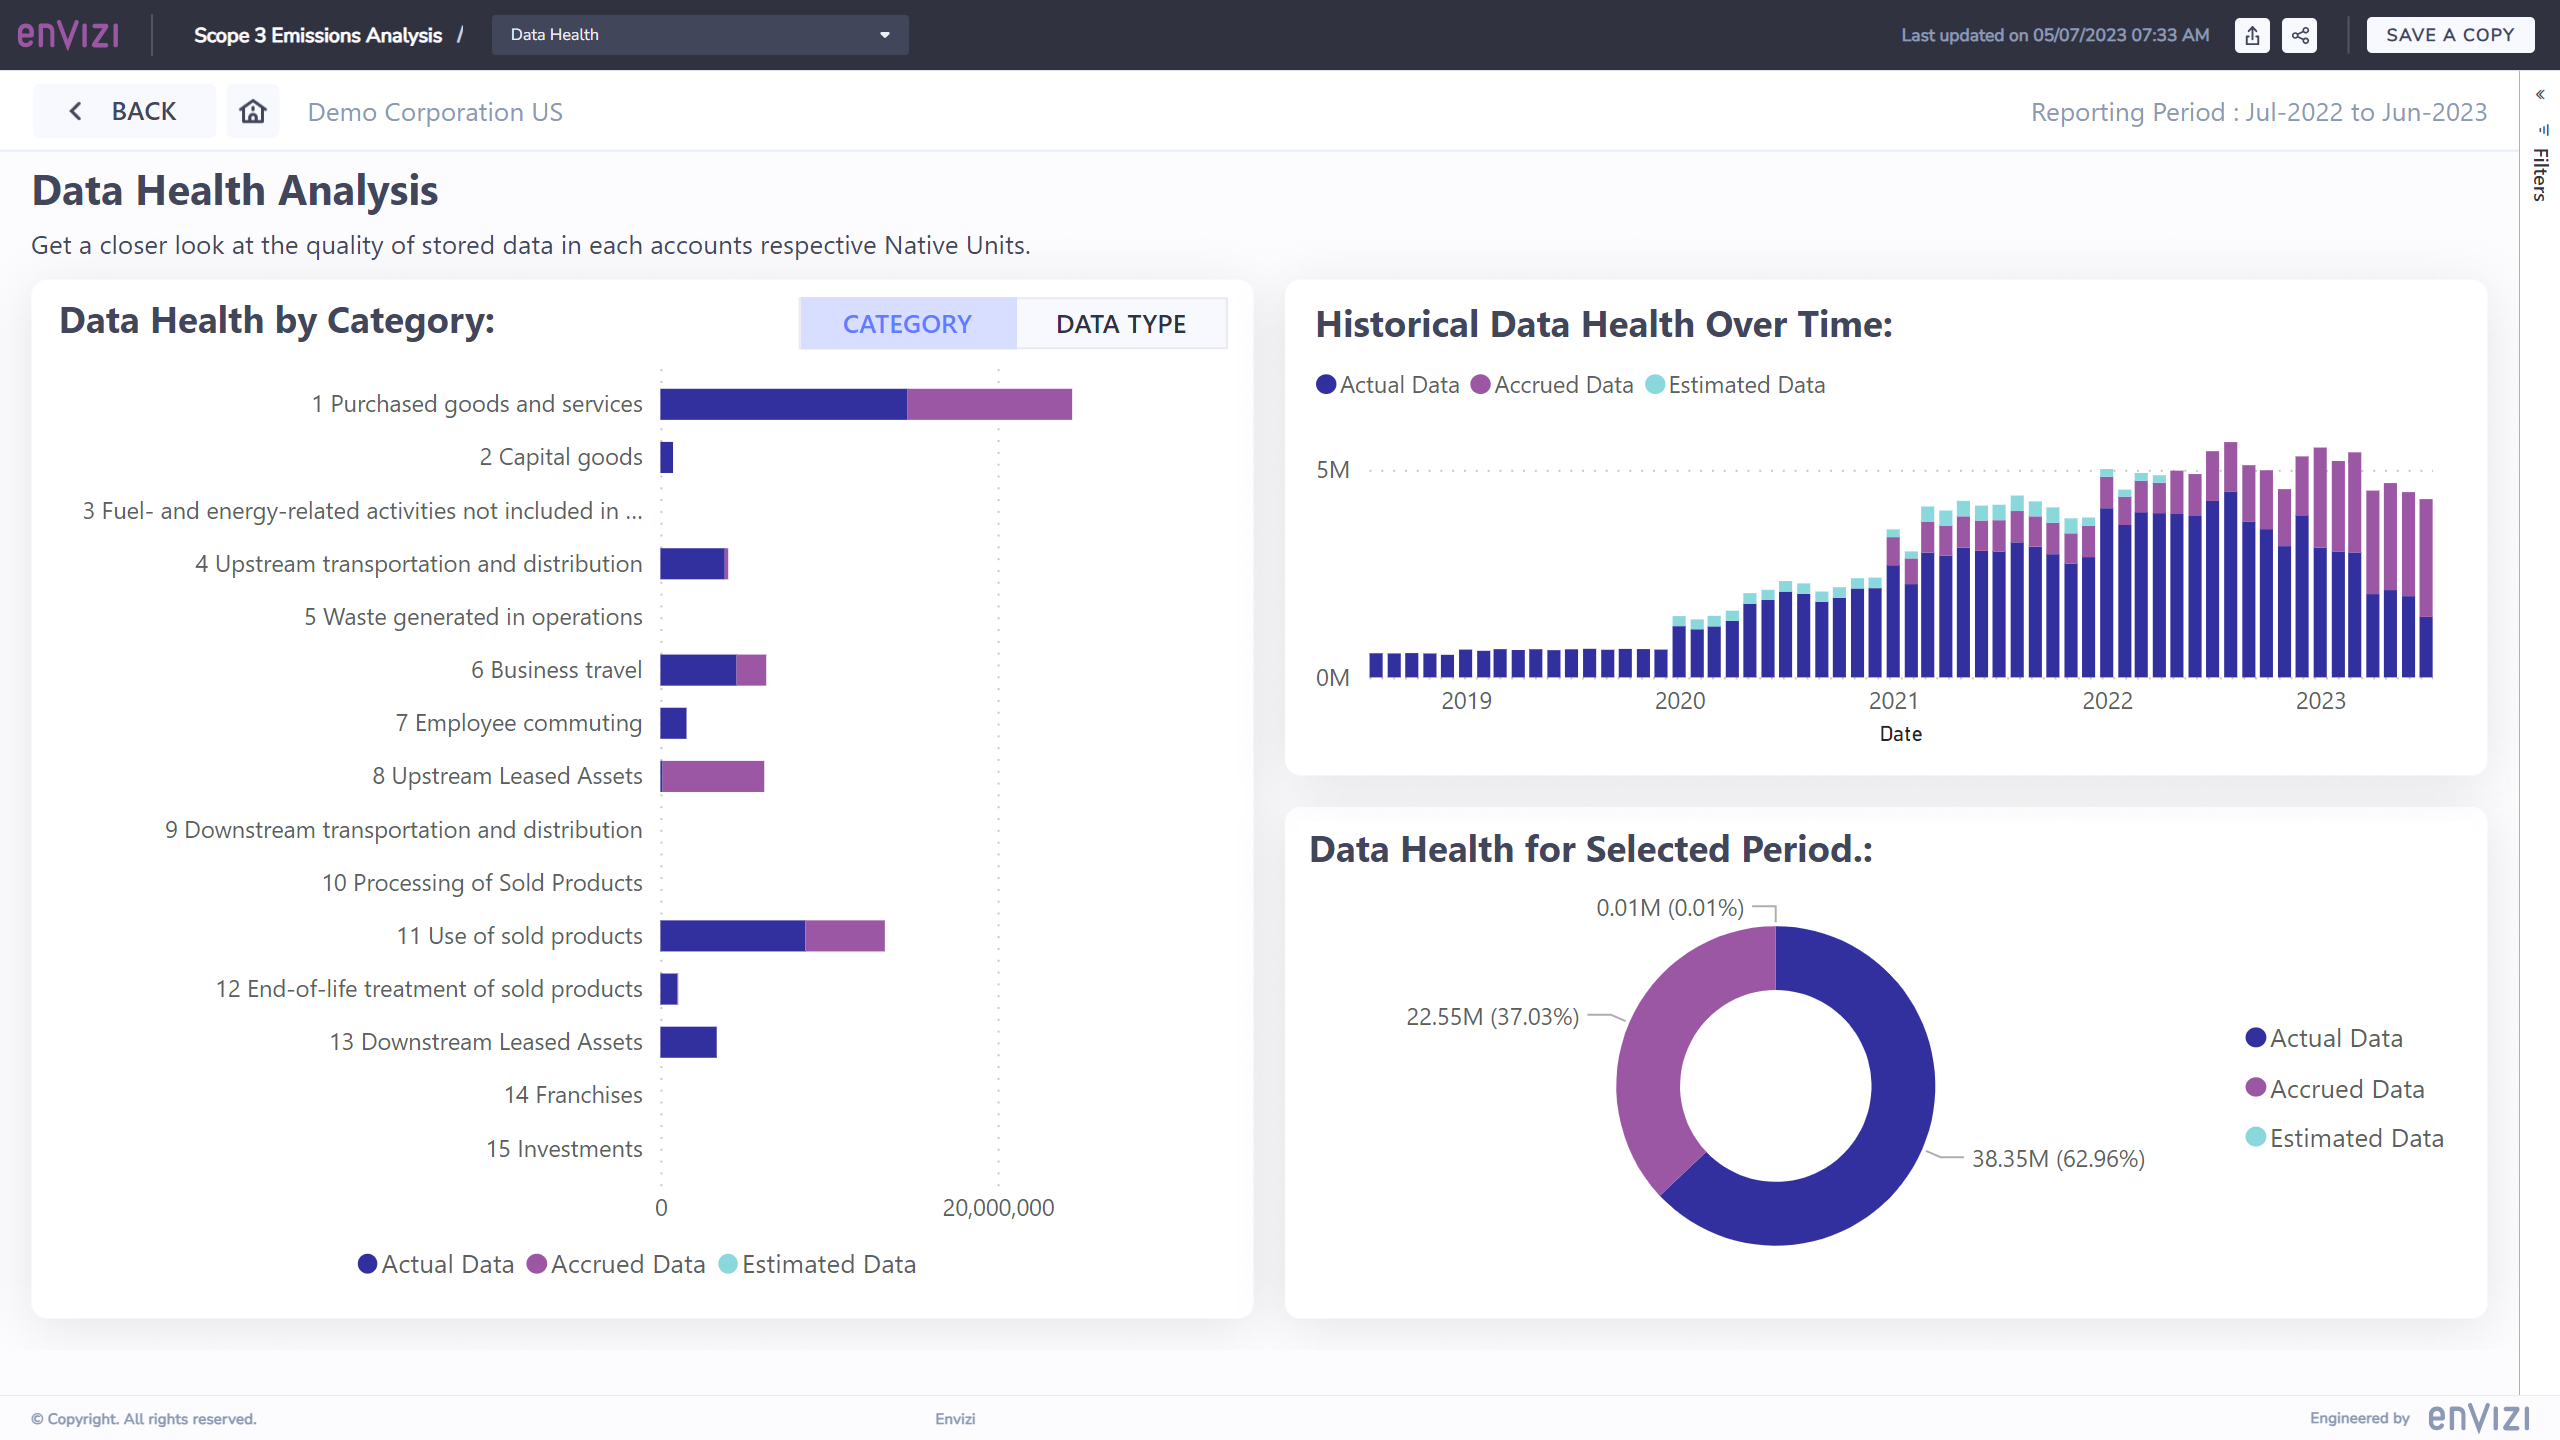
Data Health by Category or Data Type: The left panel of this report showcases the data health, allowing you to view it either by category or by data type. You can effortlessly switch between these options using the buttons located at the top right corner of the panel. The displayed data reflects the reporting period selected on the cover page, ensuring relevance to your specified timeframe.
Historical Data Health View: The top right panel provides a valuable historical perspective on the data health over time. This feature enables you to analyze trends and identify any potential data health issues that may have arisen in previous reporting periods. By understanding the historical patterns, you can proactively address any data quality concerns and ensure accurate and reliable reporting.
Overall Data Health Ratio: The final panel, located at the bottom right, presents the overall ratio of data health. This ratio specifically pertains to the reporting period selected on the cover page. It provides a comprehensive assessment of the overall data health status, allowing you to gauge the quality and reliability of your data for the given reporting period.
By utilizing these panels, you can effectively monitor and evaluate the data health within Envizi, identify potential issues, and take necessary actions to maintain data accuracy and integrity throughout your reporting processes.