Solar Performance and Payback Report
The Solar Performance and Payback Report demonstrates the performance of each solar installation over its lifetime and tracks payback.
The report is an excel report template and contains 5 tabs that show performance and payback as well a tab that performs error checking on the all solar data.
You can generate this report from the main Monitor menu under the Solar heading.
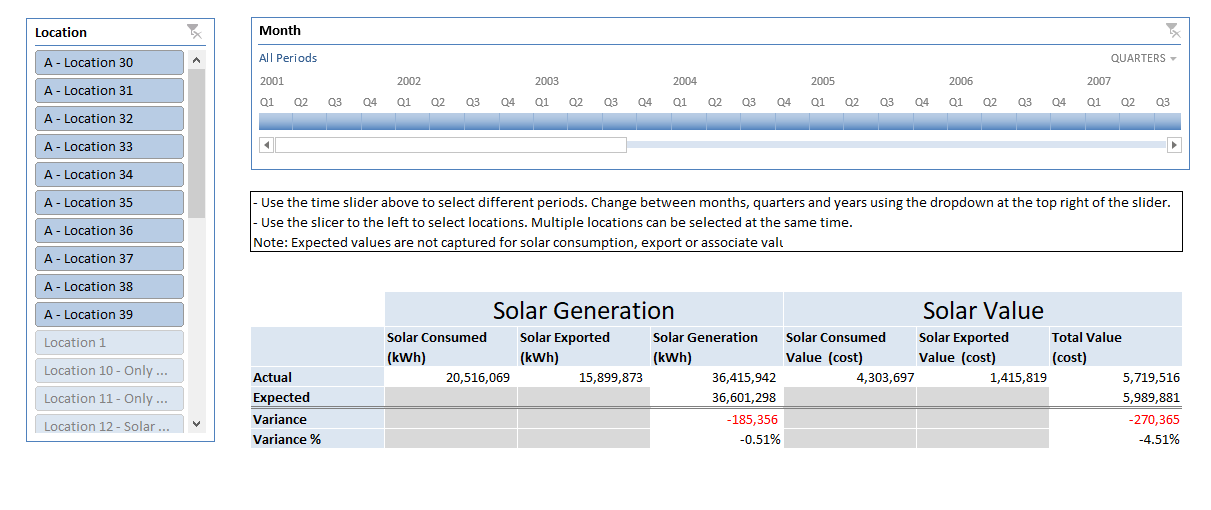
Summary
This tab focuses on overall performance across the entire portfolio. Both solar consumption and export can be viewed and comparisons of actual generation against expected are available. A location slicer and time sliders are available to drill-down to a more detailed level.
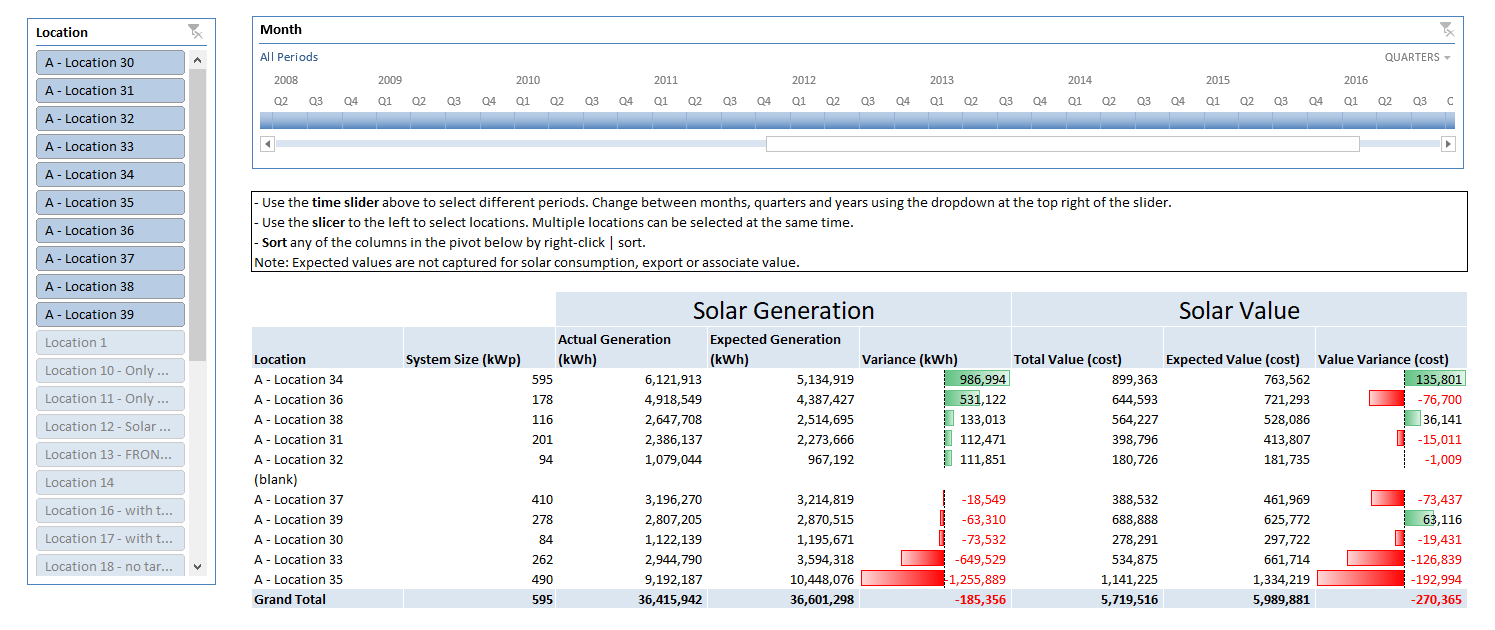
Performance
This tab can be used to rank locations within your portfolio according to performance, both in terms of solar generation and value against the business case.
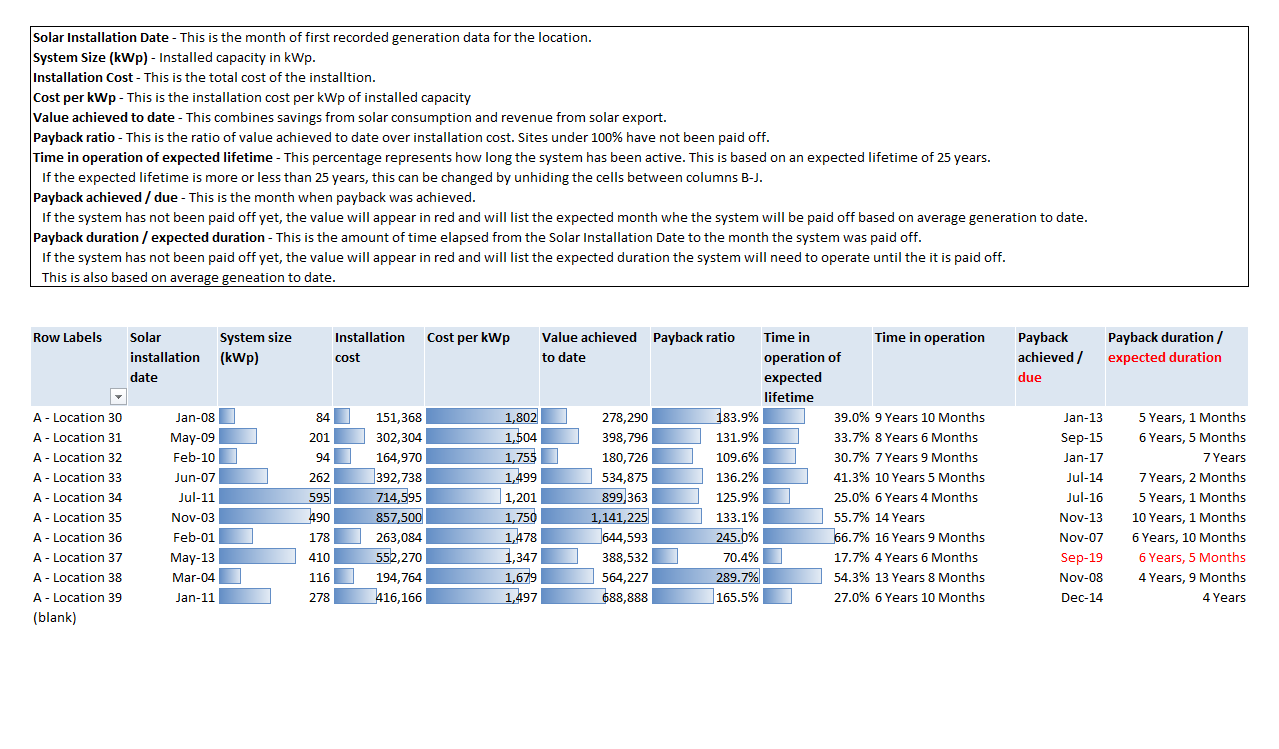
Payback
The payback tab shows how locations are tracking against the business case and focuses on if the site has achieved payback, and if not then when is it expected to achieve payback. Other information around the system size and relative cost is provided to help demonstrate materiality.
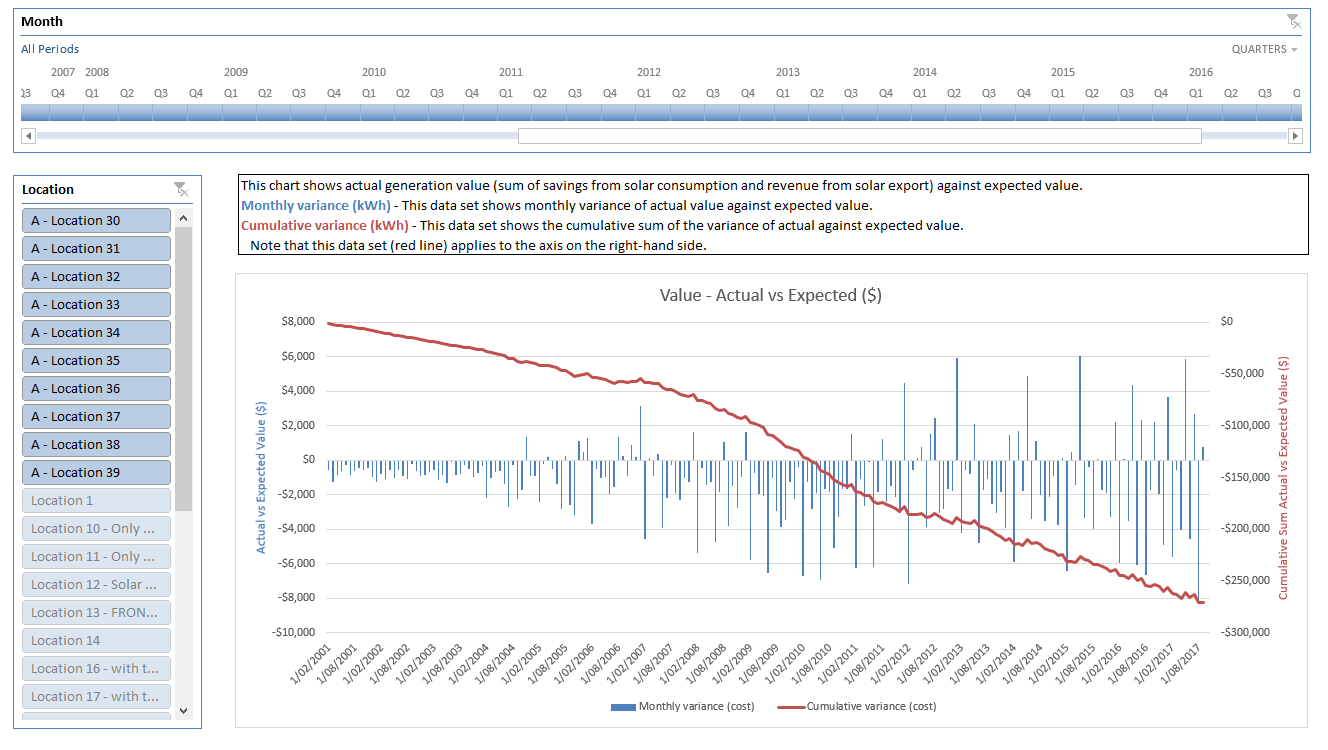
Value Cusum
This tab highlights performance over time in financial terms and will show how your portfolio compares to your original business case. Note that rates for grid electricity and feed-in tariffs can be changed in Envizi at a site level.
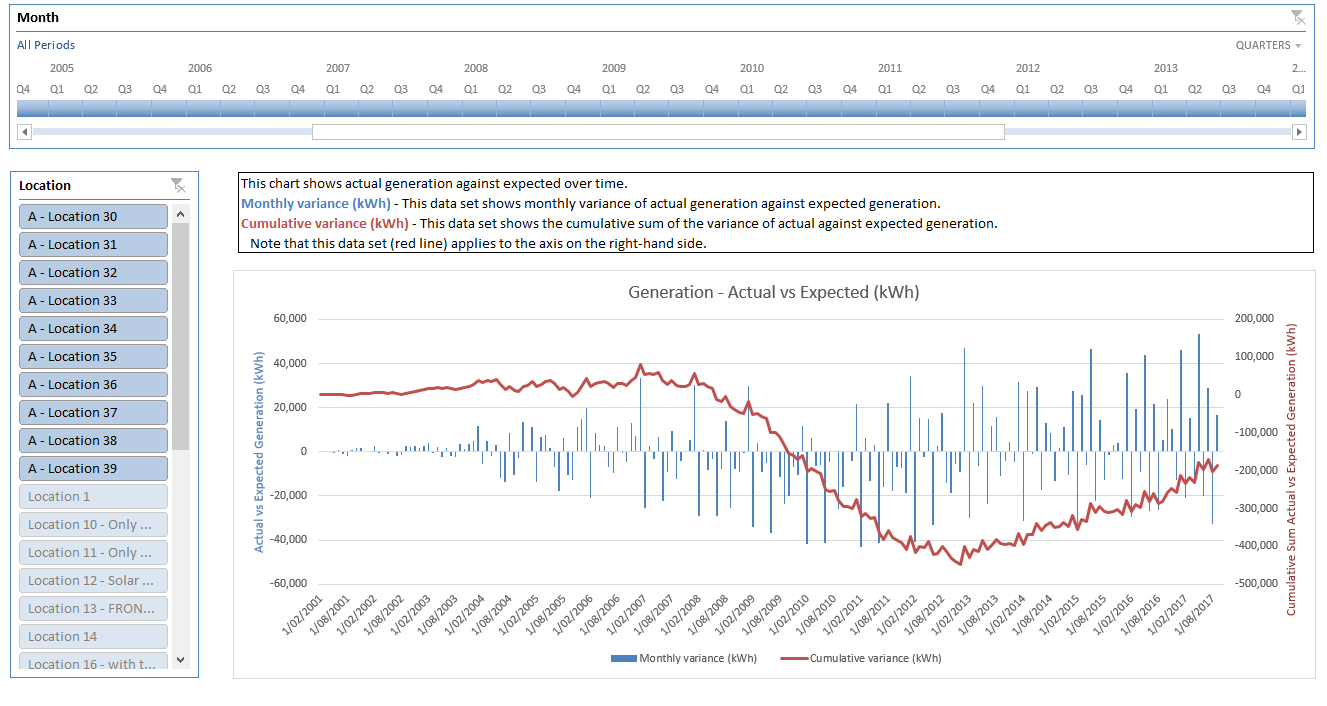
Generation Cusum
This tab highlights performance over time and is useful for understanding the trend of your portfolio, or individual sites.
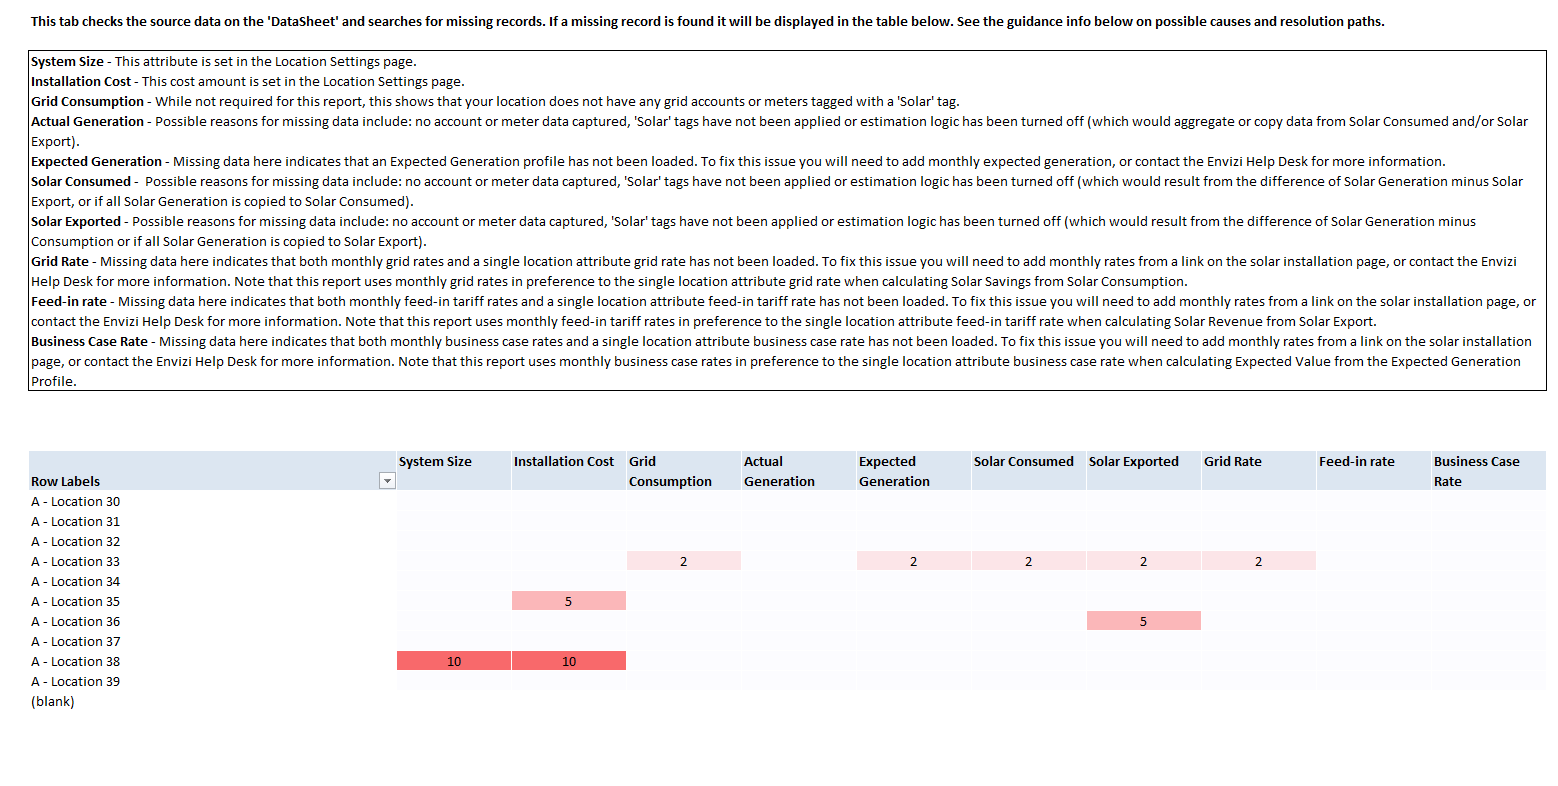
Error Checking
This last tab will highlight any areas of missing monthly data. This includes all activity data (grid, solar generation, consumption and export) as well as expected generation, rates and solar installation attributes.