
Programs - Scenario Modeler Tool
Summary
The Scenario Modeler Tool is a power report that allows you to model sustainability initiatives by plotting the impact of planned sustainability, energy or financial actions into the future. Alongside your projected targets, the modeler tool provides an estimated reading of your future sustainability performance to inform data driven decision makings.
How to find the report
Search for report name ‘Scenario Modeler Tool’ in the global report search bar, or find the report via the ‘PowerReports’ quick link on the home page.
How to use the tool
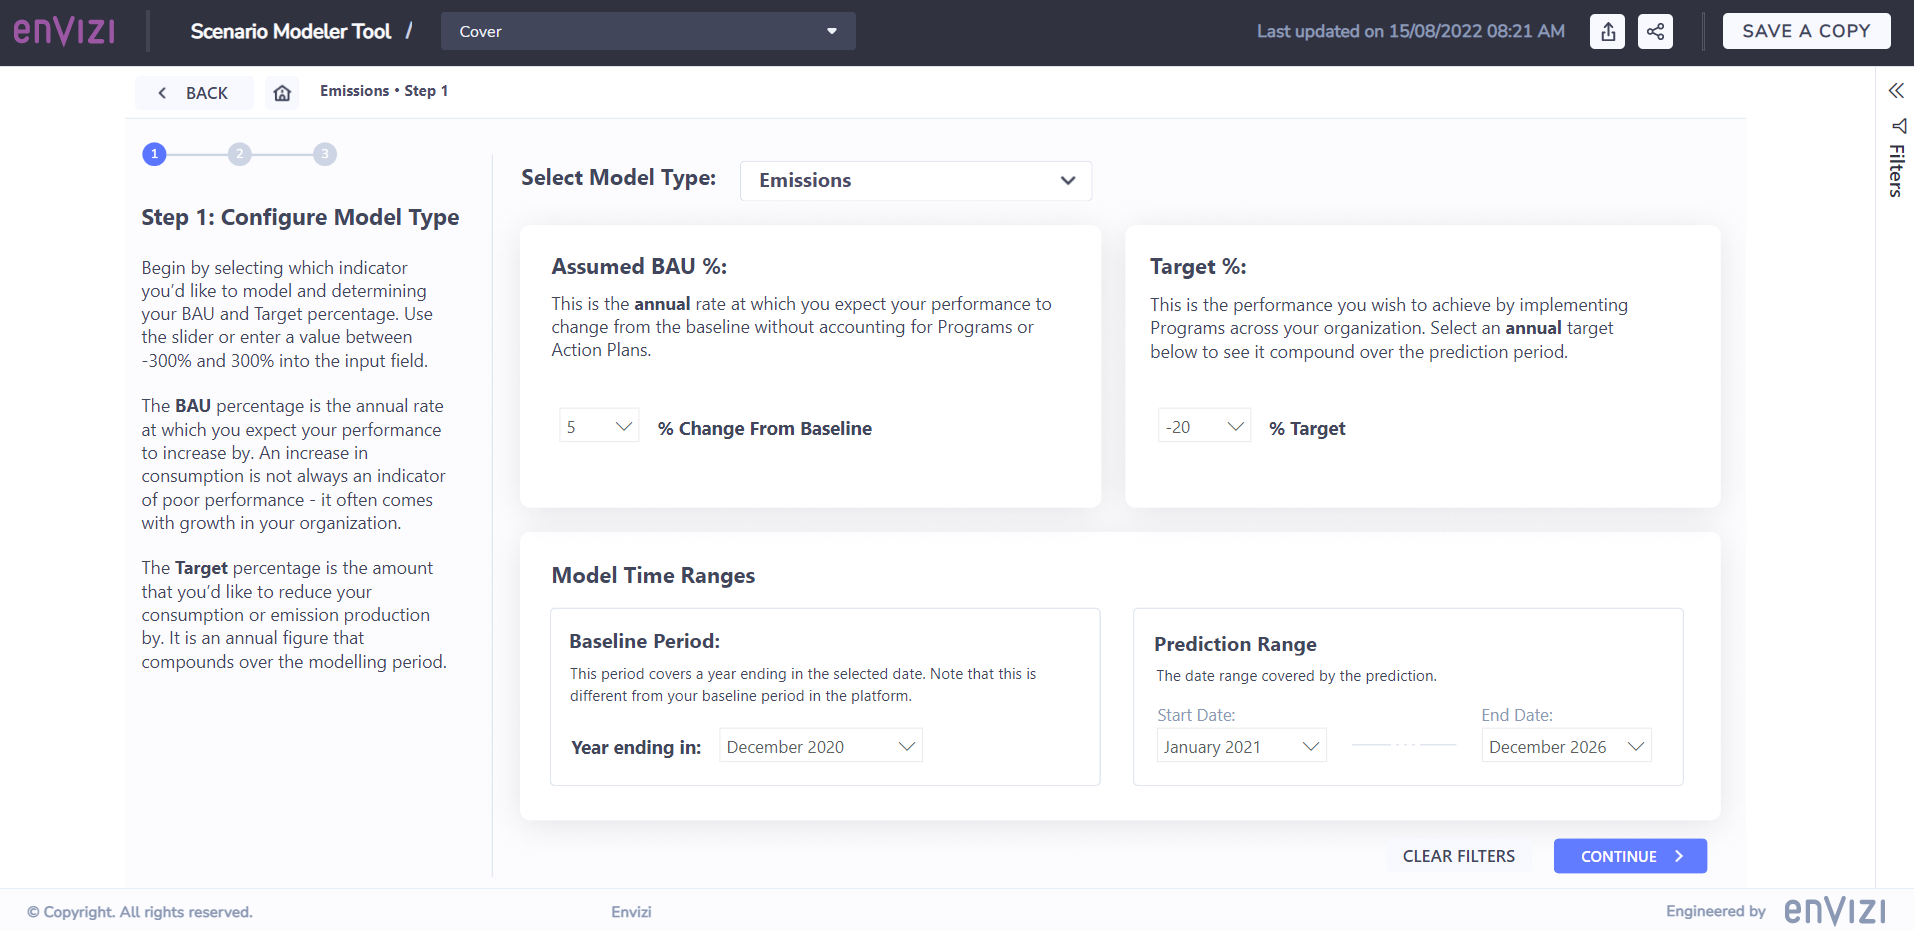
Step 1 - Configure Model Type and basic modeling parameters
Model Type - choose any one of the Emission, Energy, Cost or Native Units to begin your modelling exercise. Once selected, it will remain the main reporting unit throughout the rest of the report.
Baseline Period - one year period in which data is being used as the baseline to calculate future BAU and Target consumptions.
Assumed BAU % - an expected annual percentage of business-as-usual growth of your data based on baseline period. This is used to indicate what if there is no reduction strategy in place how the data will look like into the future.
Target % - an expected annual target reduction percentage based on baseline period.
Prediction Range - the range of period to be modeled, typically into the future. It could be in any range as long as there is either activity data, or estimated program savings captured for the month.
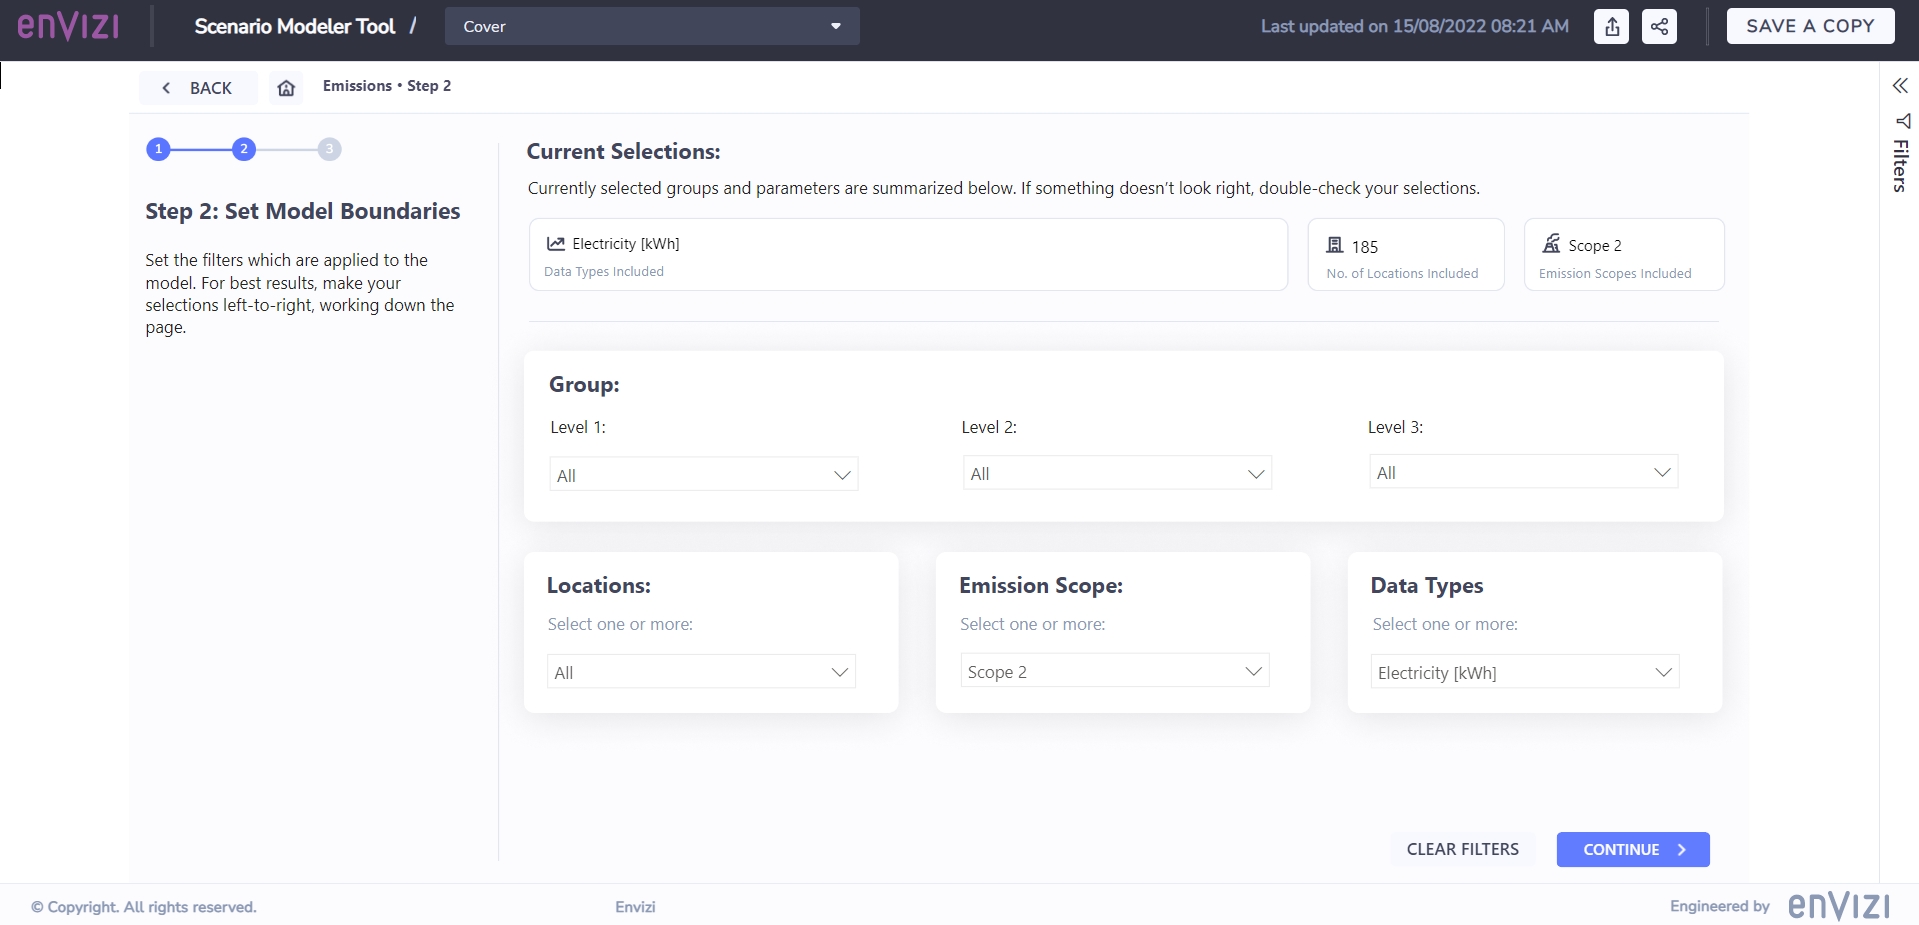
Step 2 - Set Model Boundaries on your activity data set
Choose which locations or groups to be included in your analysis. Here you can also adjust the data selections by Data Type or by GHG Scope.
Step 3 - Select Programs, Action Plans and Actions (initiatives) to be included
Define the selection criteria of Programs data to be included. The following filtering options are supported:
Programs (Programs module data hierarchy)
Action Plans (Programs module data hierarchy)
Action Type (Action attribute)
Action Status (Action attribute)
Action Class (Action attribute)
Action Priority (Action attribute)
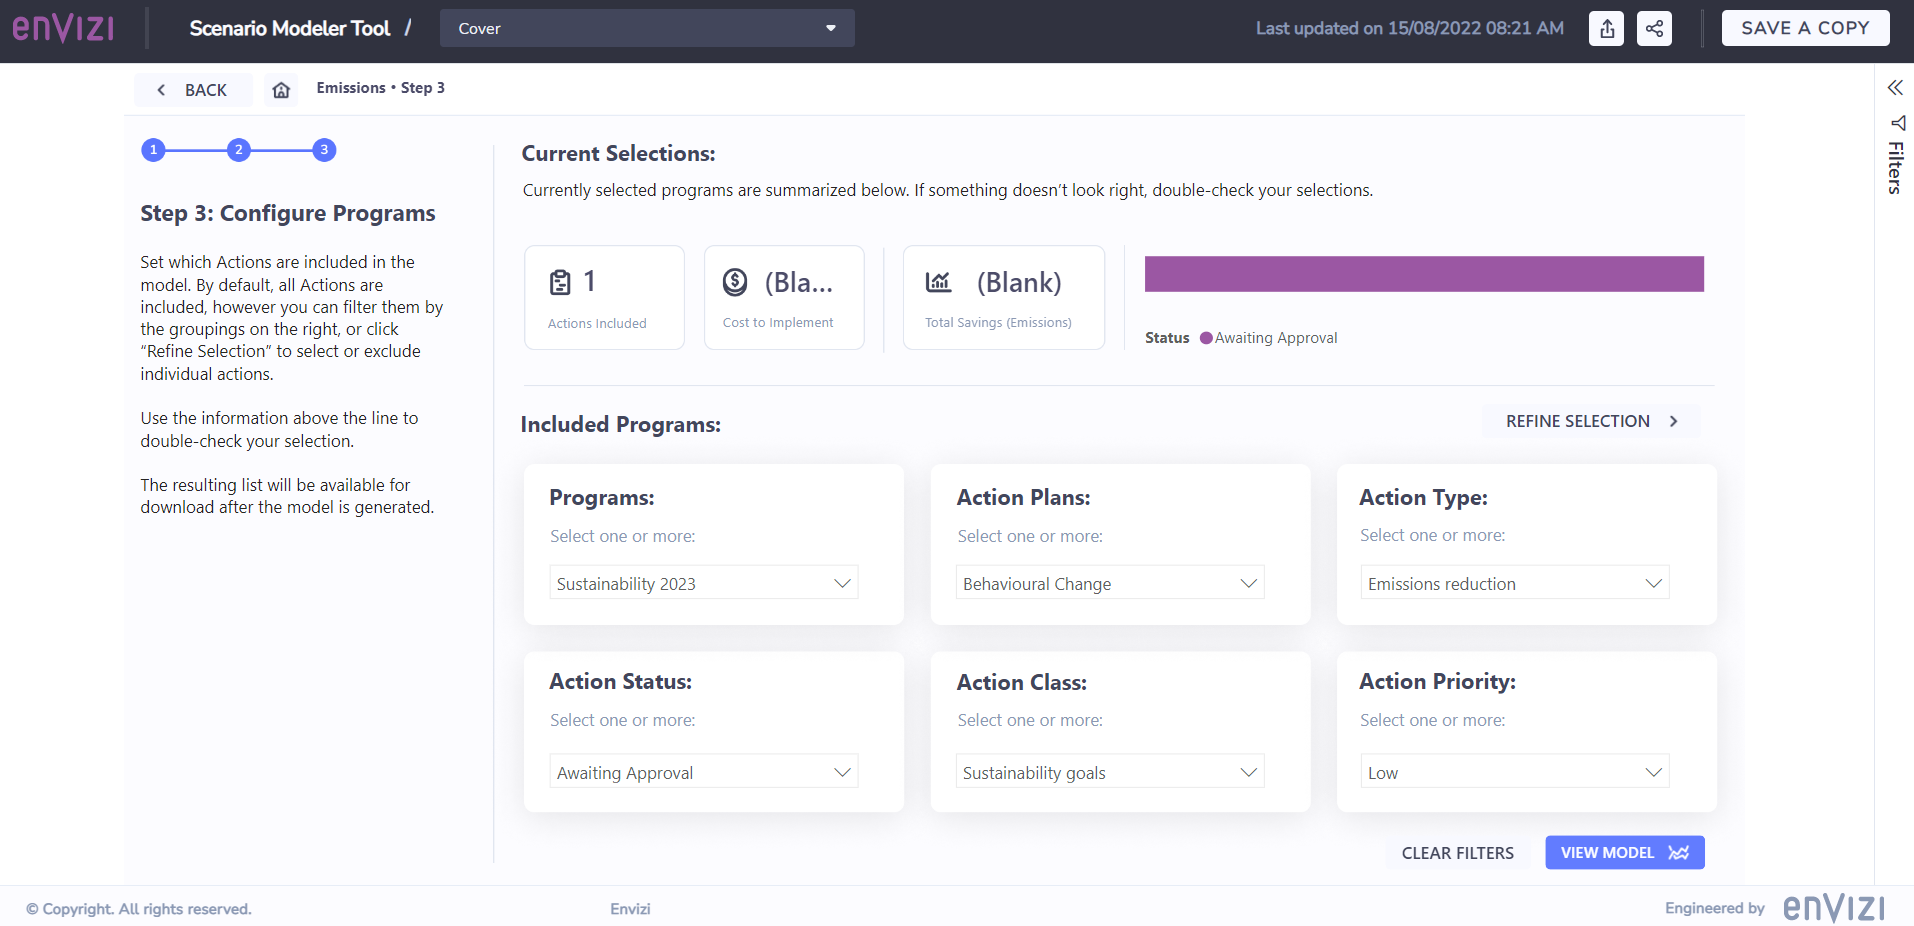
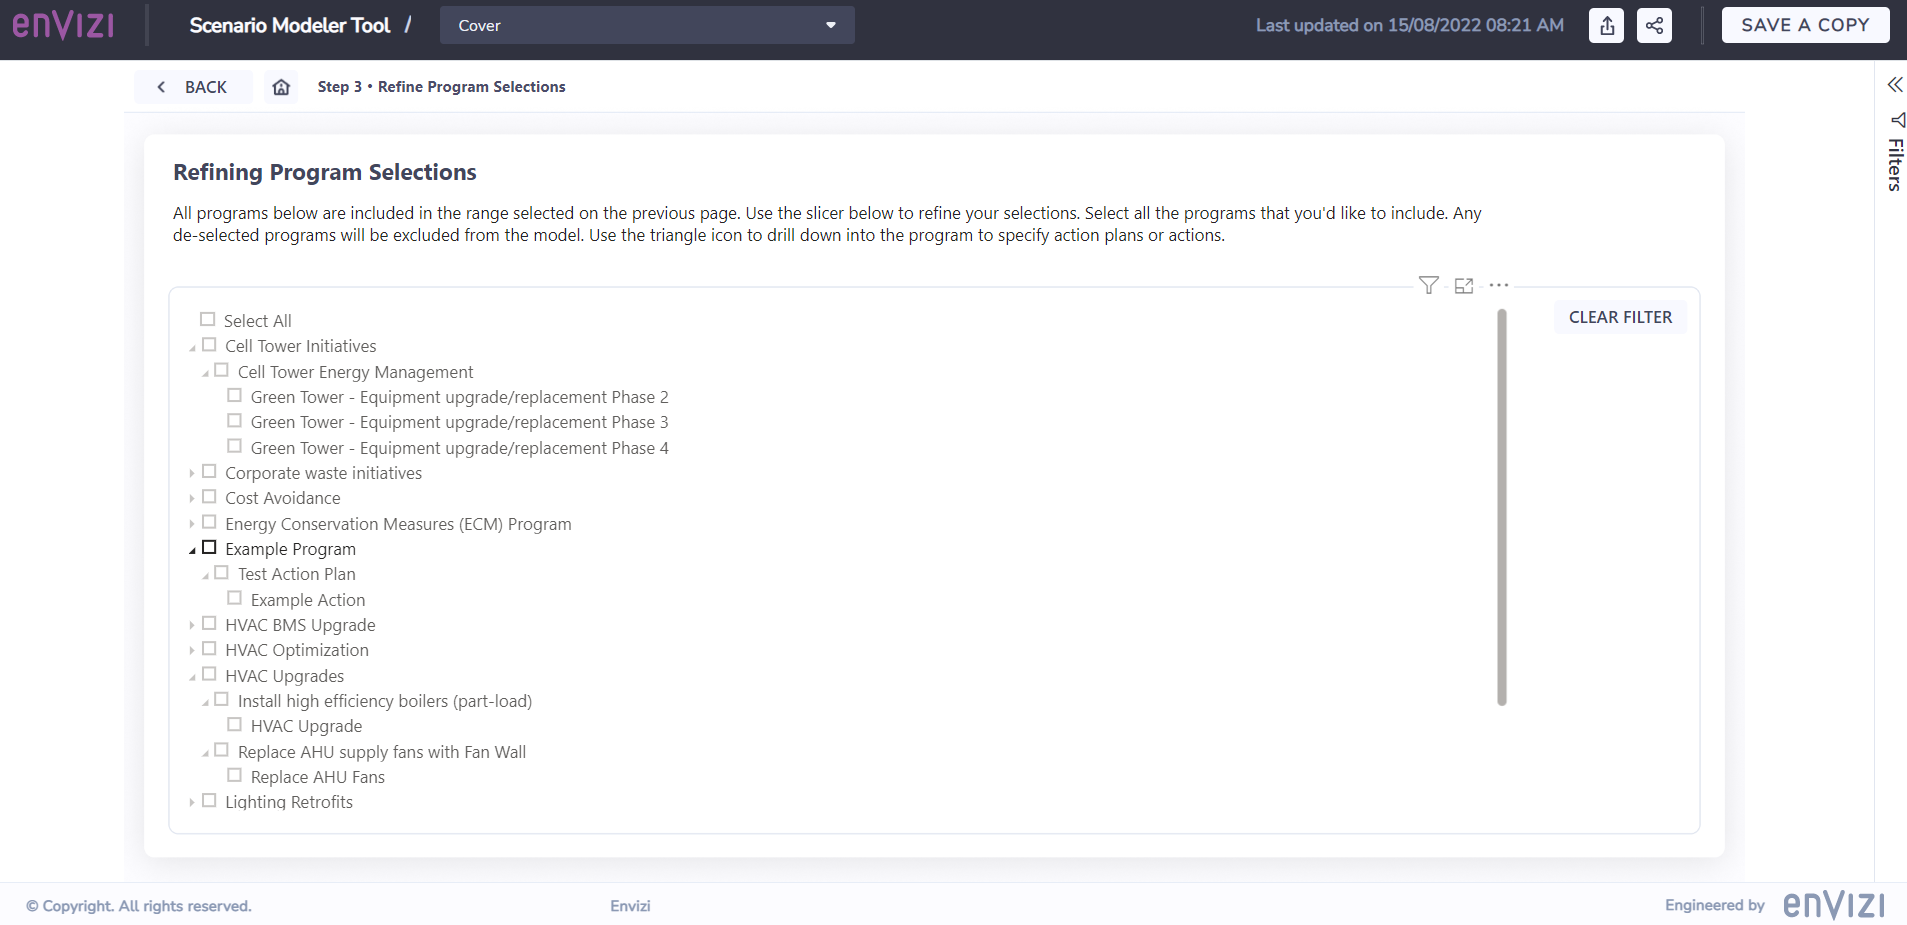
The ‘REFINE SELECTION’ page allows you to further refine the selection criteria by including or excluding individual Actions, if that is required.
Step 4 View Modeling Result
The modeling result can be viewed on the next page. There are primarily 4 lines being plotted here:
BAU - the business as usual line shows how your activity data will perform based on the BAU % increase specified in the model, calculated from data in the baseline period as defined in Step 1. The % increase is being calculated linearly each year. This is also known as the ‘Do Nothing’ line by assuming there is no initiatives being planned.
Actual - the Actual consumption data captured in the platform. This is the real time activity data being reported when the modeler tool is run.
Target - the target line shows the desired target values with a yearly reduction % from the baseline period (both are set in Step 1). The target values are being derived linearly year on year.
Expected After Program - this is the expected profile by incorporating the estimated programs savings. It equals to BAU line minus Programs Savings amount. This line should be as close to the Target line as possible, and even to run below it to exceed the target.

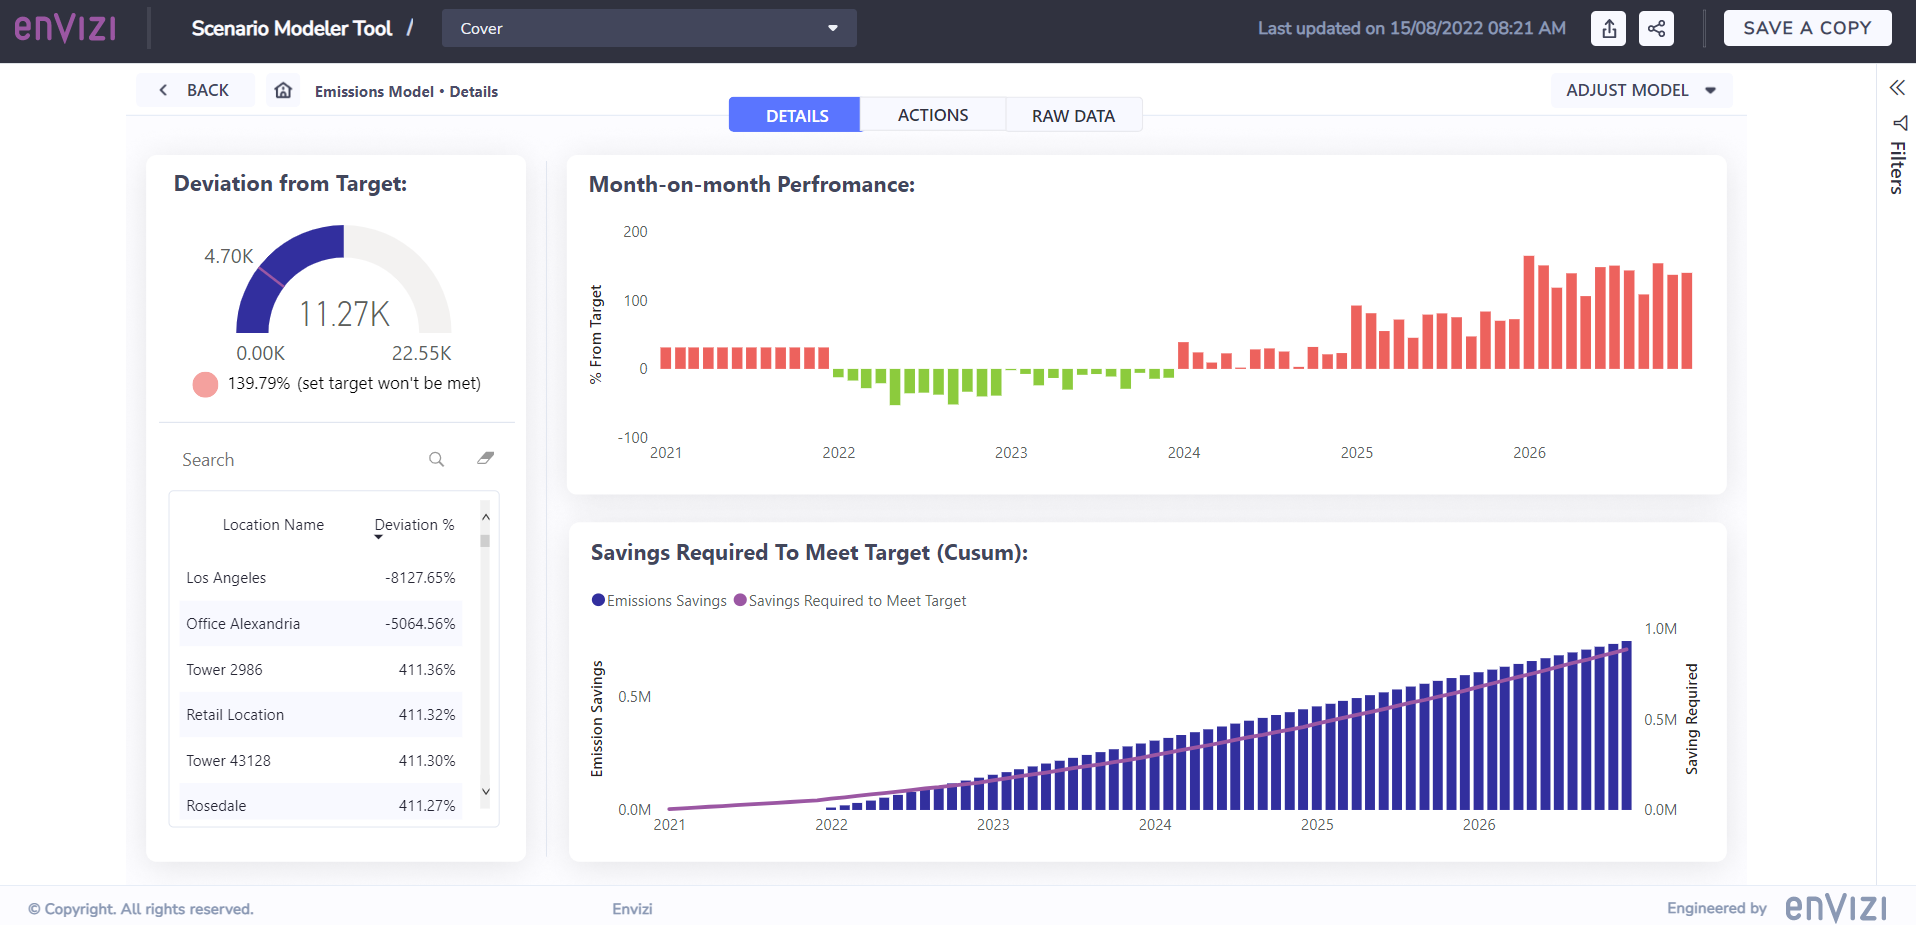
Step 5 Review Details
You can further view details such as how much each location deviates from its target, month-on-month performance, Cusum savings required to achieve target, detailed Actions list and Raw Data from the ‘DETAILS’ page.
Actions and Raw Data can further be extracted into CSV files for further data processing and reporting if required.
Global Reporting Unit
All values in the tool are being converted a single global reporting unit rather than using local unit during data entry. The reporting unit of Emission, Energy and Cost are determined by your organization’s global reporting unit settings. These can be found under menu Admin → Organization Preferences → Reporting and Dashboard Preferences (available to System Admin users only). If the global reporting units are not set, then default reporting unit would apply.
Emission - default is metric tons
Energy - default is GJ
Cost - default is USD
Data Pre-Requisite
1) Baseline Period data
In order to effectively use the report, you would need to have at least one year of historical data in the platform to serve as the Baseline period.
2) Expected Savings
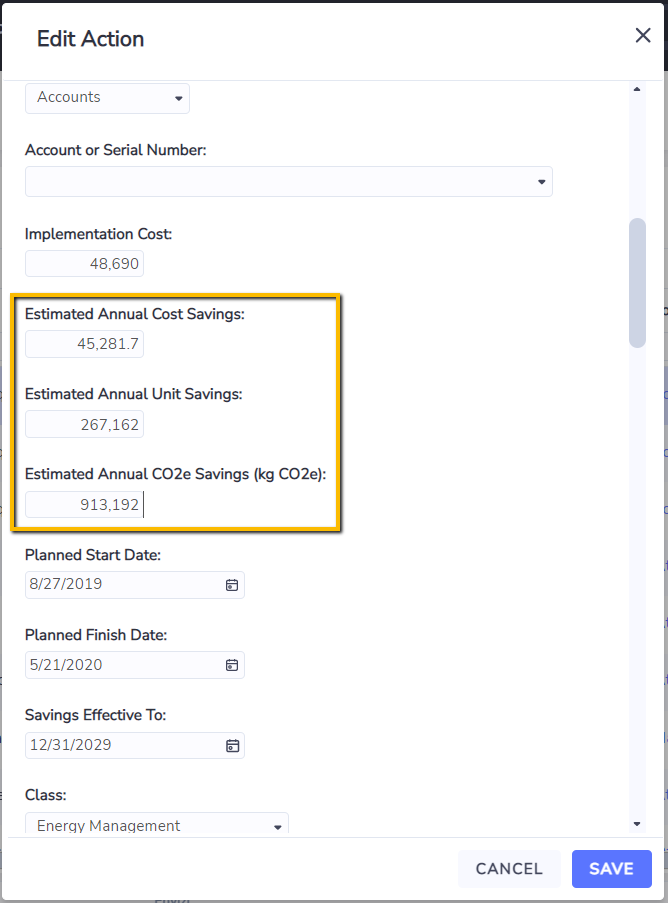
The expected savings amount comes from the values that have been entered in Actions. Depending on the model type, one or more than one of the following fields would be required:
Emission Savings - Estimated Annual CO2e Savings (kg CO2e)
Energy Savings - Estimated Annual Unit Savings
Cost Savings - Estimated Annual Cost Savings
Native Unit Savings - Estimated Annual Unit Savings
Savings in Annual amount
Values entered into the Actions savings field need to be estimated annual values. The report apportions the annual savings amount to monthly savings amount by number of days in each month. For example, the derived emission savings in March would be slightly higher than savings in February, due to the difference of number of days in each month.
If for any reason an annualized value cannot be directly entered or requires additional derivations, the Programs module also offers a functionality to auto calculate annualized values based on pre-defined custom rules. Please approach your corresponding Envizi contact for additional services help on this.
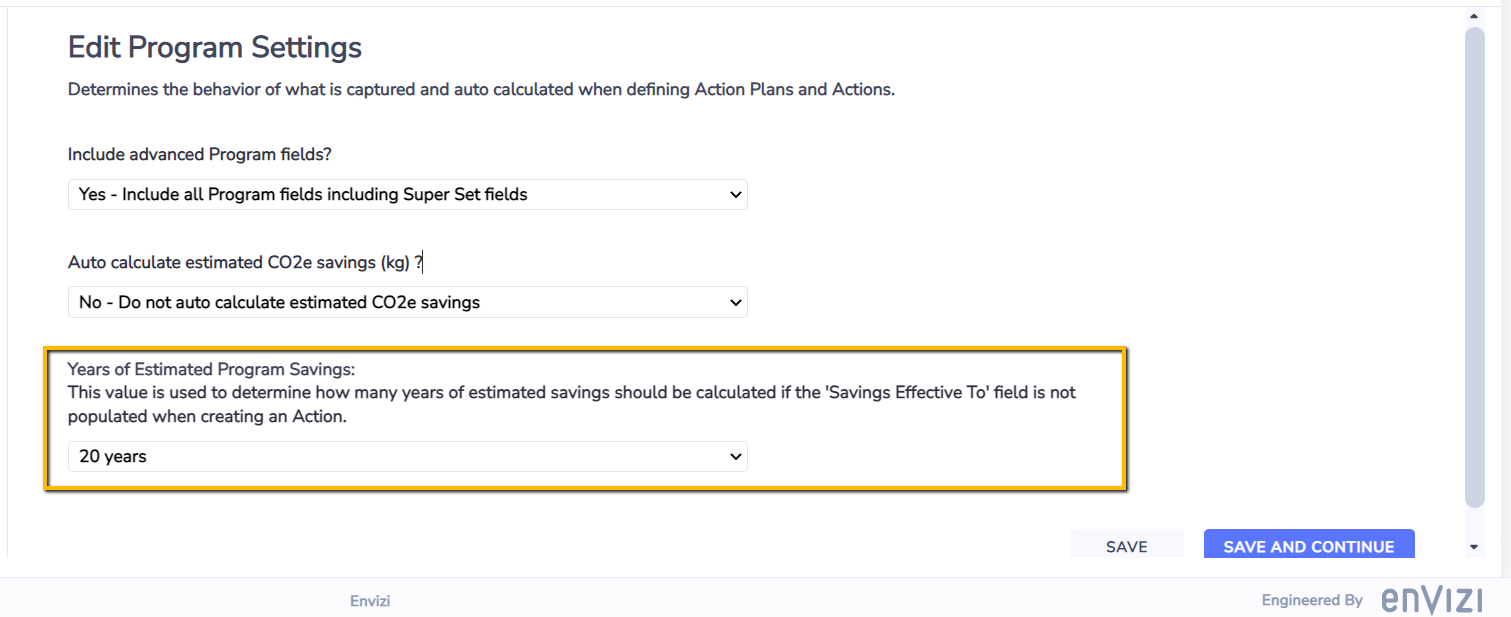
Inclusion of auto calculated estimated CO2e savings
If the ‘Auto calculate estimated CO2e savings’ feature is turned on, the auto calculated estimated CO2e savings by the system will be included in this report. However, for Actions with manually entered CO2e savings, user entered values takes precedence over system generated values, and user entered values will be used in the report instead.
3) ‘Savings Start Period’ and ‘Savings End Period’
Each Action needs to have a projected saving period. For example, an Action completed in Dec-2022 could deliver savings for the next two years from Jan-2023 (Savings Start Period) to Dec-2024 (Savings End Period).
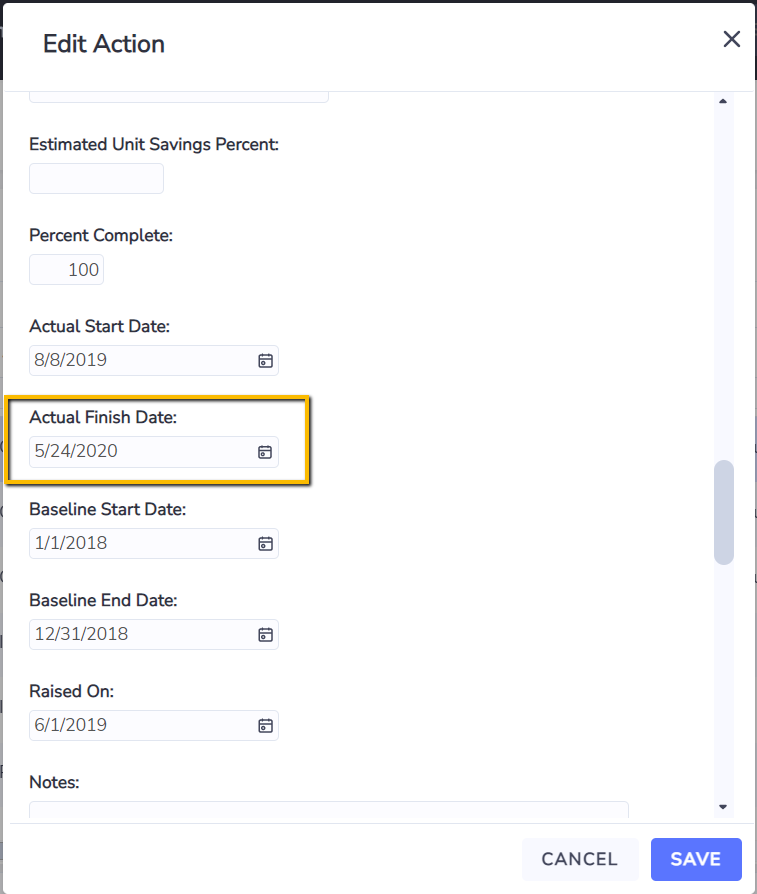
The Savings Start Period used in the tool is being defined by one of the following date fields in Action, in the order of:
Actual Finish Date (first choice) → Planned Finish Date → Actual Start Date → Planned Start Date → Raised On date → Last Updated On date (last choice if none of the previous fields has been set)
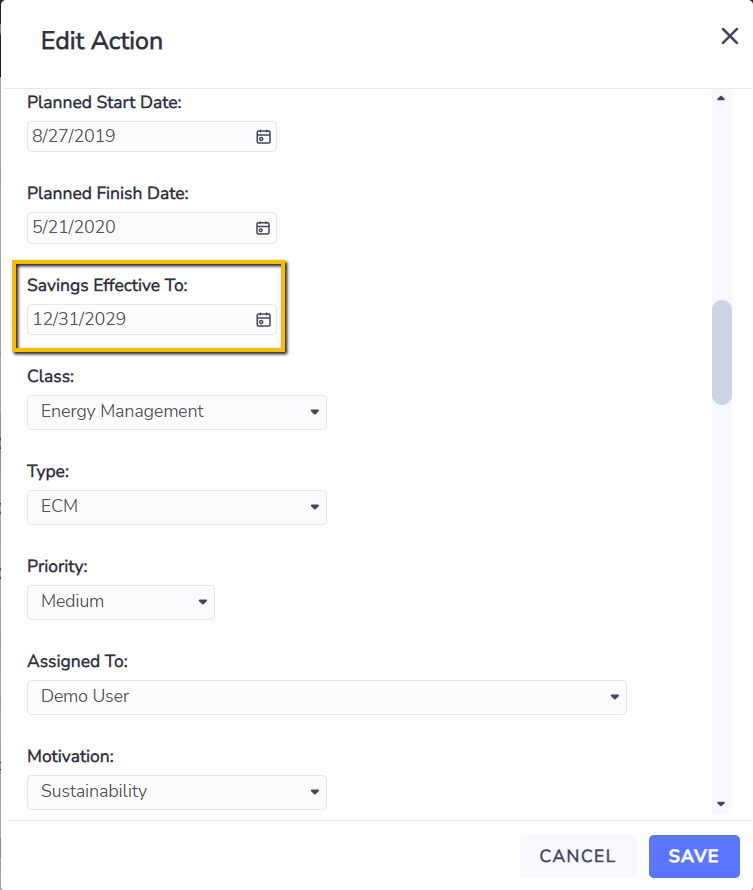
The Savings End Period is being defined by the field Savings Effective To. However if there is no date value in this field, it will default to Savings Start Period + Default number of saving years defined in the Organization setting.
4) Special Action fields
There are four basic Action fields being used in the report to allow filter, slicing and dicing Actions for various reporting purposes.
Action Status
Action Type
Action Class
Action Priority
If your organization has customized any of these fields to be in different names, or do not use any of the fields, you may notice a X sign where these fields are being used in the report. If this introduces limitations on how you can use the report, please approach your corresponding Envizi contact for help to set up a custom version of the report for your organization.
Demo Video
Below is a 4 minutes demo video that will take you through the steps for using the report.
