
Performance Trend
The Performance Trend dashboard is a flexible way for you to track performance trends across a range of time periods i.e. years, 6 months, quarters, months (any number of months up to 12 months).
The dashboard can be found in the Monitor menu for Organization level users.
and in the Track sub-menu on the “Whole of Organization” page.
The dashboard allows you to compare the selected period to the same period in previous years or compare to adjacent previous periods.
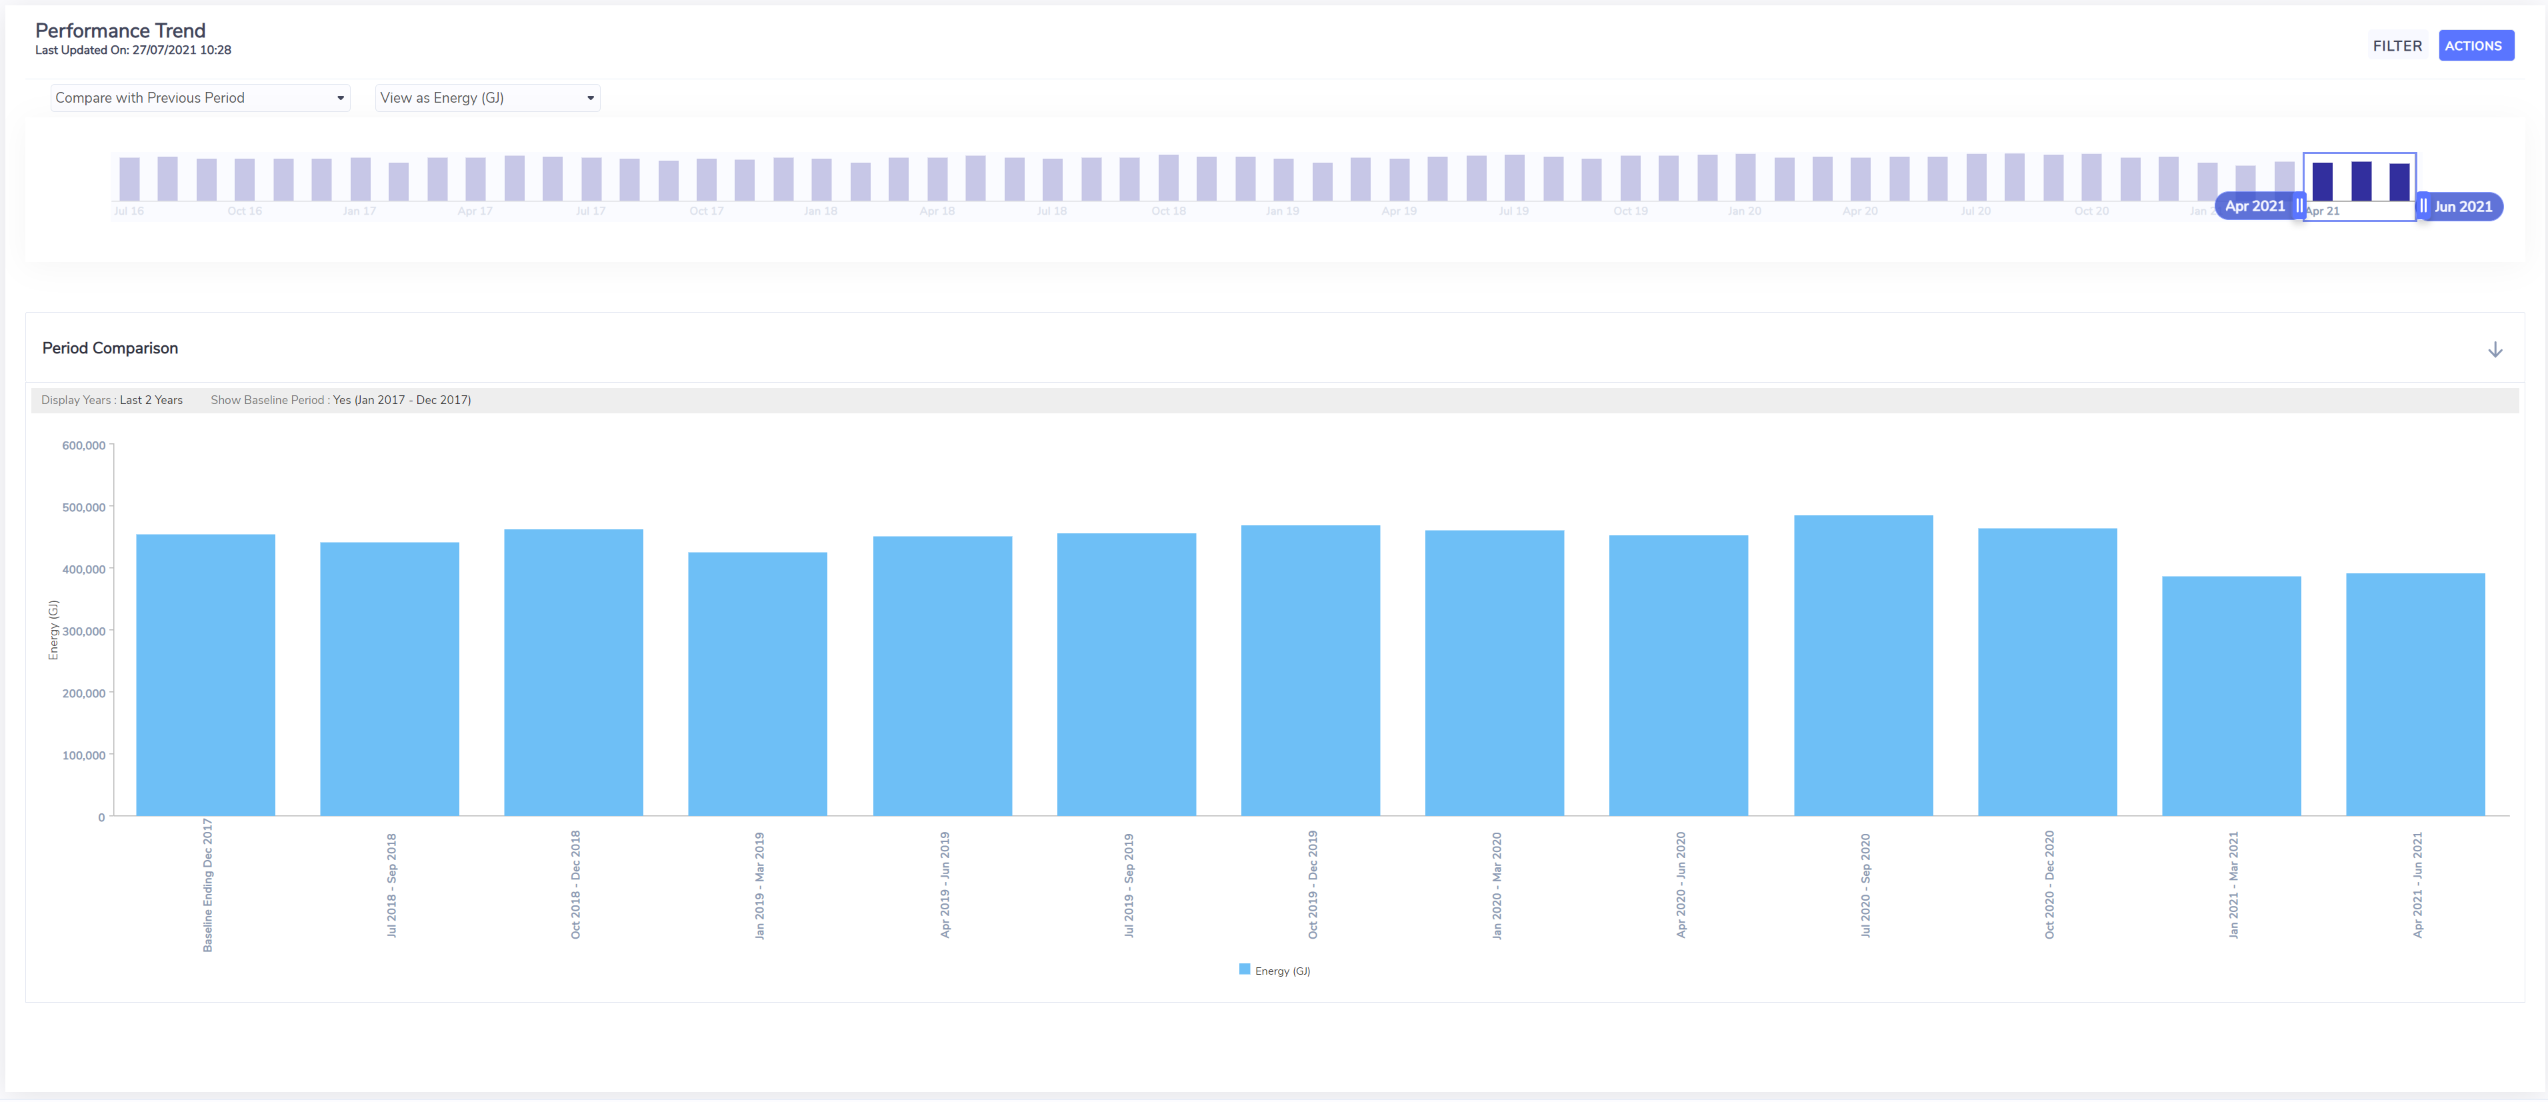
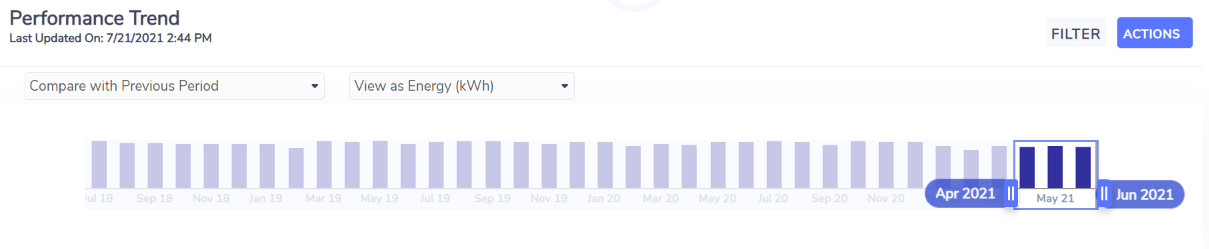
The default number of years to include in the trend is 2 years however you can adjust, in the timescale, the length of time that you would like compared. For a quarter for instance, you would ensure that three months are selected.
If your organization has a baseline year set (your system administrator can set this), then this will be included as a point of reference within your Trend Analysis.