
Monthly Data Summary Report
The 'Monthly Data Summary' report shows aggregated monthly data regardless of invoice periods (monthly, quarterly or yearly) allowing users to extract data and easily identify trends over time across their data types. You can use this data to graph trends in consumption, energy, emissions, cost as well as understand data completeness using values in the actual/estimated/accrued fields.
How to run
Global Search → Reports → Monthly Data Summary
Reports menu → Reports Category → Activity Tracking → Monthly Data Summary
Reports menu → All Reports → Search for Monthly Data Summary
This report can be used for…
Data reconciliation - Reviewing numbers and confirm data availability.
Data health check - Reviewing accrued values (cost or consumption) and discrepancies.
API integration can be used to use this report in Power BI dashboards.
Emissions auditing - this report is useful for conducting spot checks or audits on your data. To verify emissions calculation you can review the emission factors that were used, and you can view greater detail on emission factors by running the ‘Energy and Emission Factor’ report and cross-referencing by ‘Factor Link’.
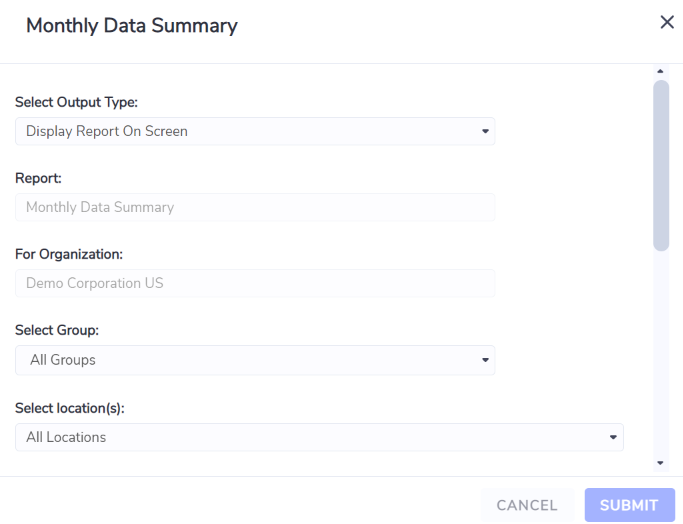
Report Selection
To find the report you can search the name in the Global Search bar.

Similar to other reports in the platform, you can make a range of selections prior to running the report. Below you can see a non-exhaustive list of the selections available.
Selection | Description |
|---|---|
Select Output Type | Display on screen, Create report and E-mail it now, Schedule report and E-mail. |
Group | Choose to run for one or all Groups. |
Location | Choose to run for one or all Locations. |
Data Type | Select a Data Type to run Report on. e.g. Electricity [kWh]. Only Accounts belong to the selected Data Type will be included in the report. |
Report Currency In | Select currency. Default is Reporting Currency set against the Organization. Currency exchange rates stored in Envizi are used to convert any local currency to the reporting currency. |
Filter By # 1 | Exclude Lifecycle Emissions: Exclude scope 3 part of Scope 1 (eg. Natural Gas) and Scope 2 (eg. Electricity) Data types. Include Lifecycle Emissions (where available): Includes Scope 3 emissions for scope 1 and scope 2 data types. example: For Electricity, user will see both scope 2 and scope 2 CO2 emissions in the report. |
Filter By #2 - Tags or consolidation | Select appropriate tags if you want report to filter based on your custom tags. By default it use the Consolidation reporting tags. |
For a duration of | Default to 1 Year. Can select 1 month, etc. |
Ending With | Choose a calendar month. |
Report Output
Once report is displayed on screen, select Download as CSV from top left toolbar in report. Below are the explanations of some of the key columns in the report:
Column | Description |
|---|---|
Start_Period | Start date of Report |
End_Period | End date of Report |
Associate | Organization Name in Envizi |
Level 1 Group | Grouping at level 1. By Default Report displays Classification group. If report is selected for a particular group, Groups are displayed accordingly. |
Level 2 Group | Level 2 Group name |
Level 3 Group | Level 3 Group name |
Country | Location Country |
Region | Region of Location |
Location | Location/Site name |
Location Reference | Location Reference |
Category | Data Type Category |
Data Type | Data Type name. For example: Electricity, Natural Gas, Water, etc. |
Item Type | Account/Meter |
Account Style/Component | Account- Account Style Meter - Meter Component |
Sub type | Sub type if configured for an account style or account to cater for different emission factors. |
Item Number | Account Number |
Account Ref/Meter Name | Linked Meter Name |
Supplier | Supplier Name |
Reader / Notes | Reader field for Account / Notes for Meter |
Opened_On | Account/Meter Open Date |
Replaced_On | Account/Meter Closed / Replaced on Date |
Occurred_On | Calendar month of the data |
Units | Unit of measure |
Actual Data | Actual Data |
Estimated Data | Estimated data |
Accrued Data | Accrued Data |
Total Data | Total of Actual + Estimated + Accrued |
Actual Days | No. of Days of Actual data entered in the month |
Estimated Days | No. of Days of Estimated data entered in the month |
Accrued Days | No. of Days of Accrued data (if Accruals are on for the account style, and there is no actual or estimated data for a period) in the month. |
Total Days | Total Days for Actual + Estimated + Accrued Days |
Actual Percent | % of actual Data |
Estimated Percent | % of Estimated data |
Accrued Percent | % of Accrued Data |
Use Type | Tag type name (by Default: Consolidation) |
Use | Tag name |
Use Percent | Reporting % of Tag |
Group Membership Percent | Grouping membership % |
Total Reporting Amount | Total Reporting Amount after applying Group Membership % and Use % on 'Total Data'. This amount is used in Different dashboards and should be picked when doing reporting. |
Energy Consumed (GJ) | Energy consumed in GJ |
Energy Produced (GJ) | Energy produced in GJ |
Total GJ | Total Energy in GJ |
Scope 1 CO2e(t) | Scope 1 Emissions of CO2 |
Scope 2 CO2e(t) | Scope 2 Emissions of CO2 |
Scope 3 CO2e(t) | Scope 3 Emissions of CO2 |
Other CO2e(t) | Other emissions |
Total CO2e(t) | Total of Scope1+ 2 + 3 + Other Emissions |
Actual Cost | Cost of Actual Data |
Estimated Cost | Cost of Estimated Data |
Accrued Cost | Cost of Accrued Data |
Total Cost | Total Cost |
Total Reporting Cost | Total reporting Cost after applying Group Membership % and Use % on 'Total Cost'. |
Cost_Unit | Currency unit |
Group_By | Unique field made of Account/Meter Internal ID + Data Type which can be used for grouping of data. |
Account_Meter_Link | Account/Meter internal ID or unique identifier which can be used in linking tables in BI reporting. |
Factor Name | Name of the Emission Factor used to calculate Scope 1, 2, 3 or Other emissions. |
Factor Value (kgCO2e/unit) | Emission factor value in the unit of measure as defined in the ‘Units’ column. |
Factor Source | Source of the emission factor. Most emission factors listed in this report will come from one of Envizi’s managed factor sets. |
Factor Link | This is an ID field that provides a unique link to the emission factor. Run the ‘Emission and Energy Factor’ report to cross reference emissions data with factor details using the ‘Factor Link’ ID. |