
MB Emissions - Renewables
This page outlines the functionality of the Renewables page in the Market-based Emissions report.
Summary boxes
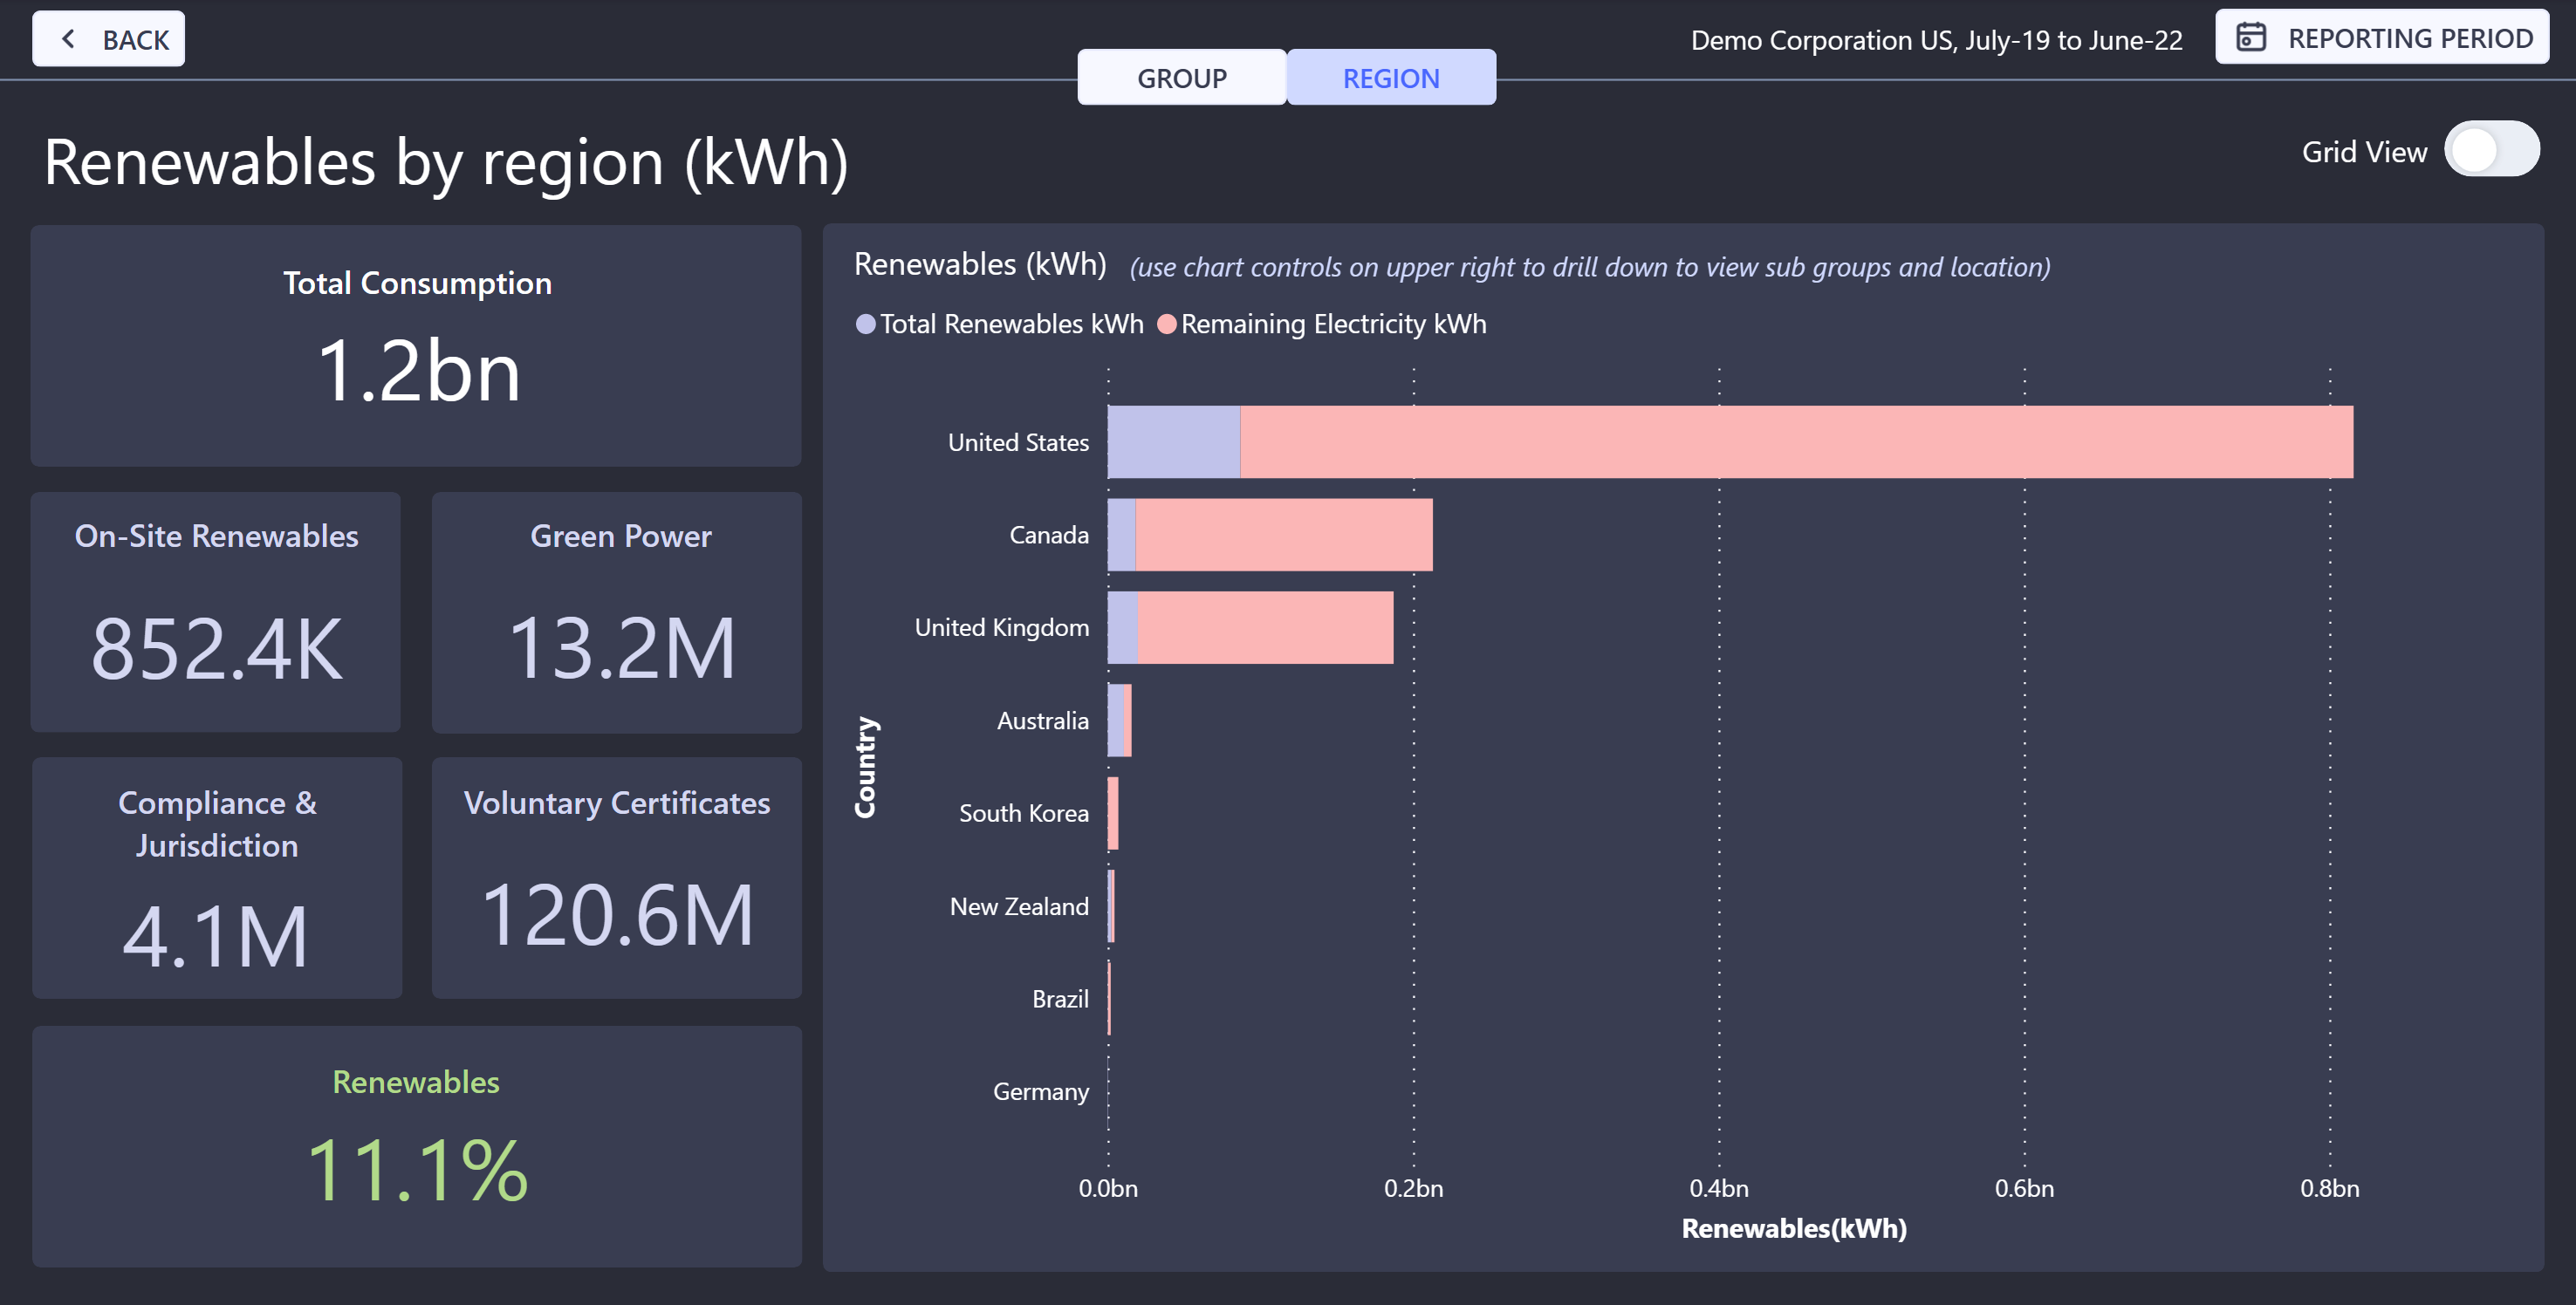
On the left-hand side there are 6 summary boxes showing total consumption, 4 categories of renewables and renewable percentage at the bottom. For definitions of these categories you can refer to the Certificates Allocation page.
Charts
The stacked bar shown in the chart above represents total electricity consumption for the reporting period with the quantity in blue representing total renewables and red representing grid electricity consumption.
By default this chart shows consumption by region, but clicking Group at the top of the page with show consumption by Group.
Grids
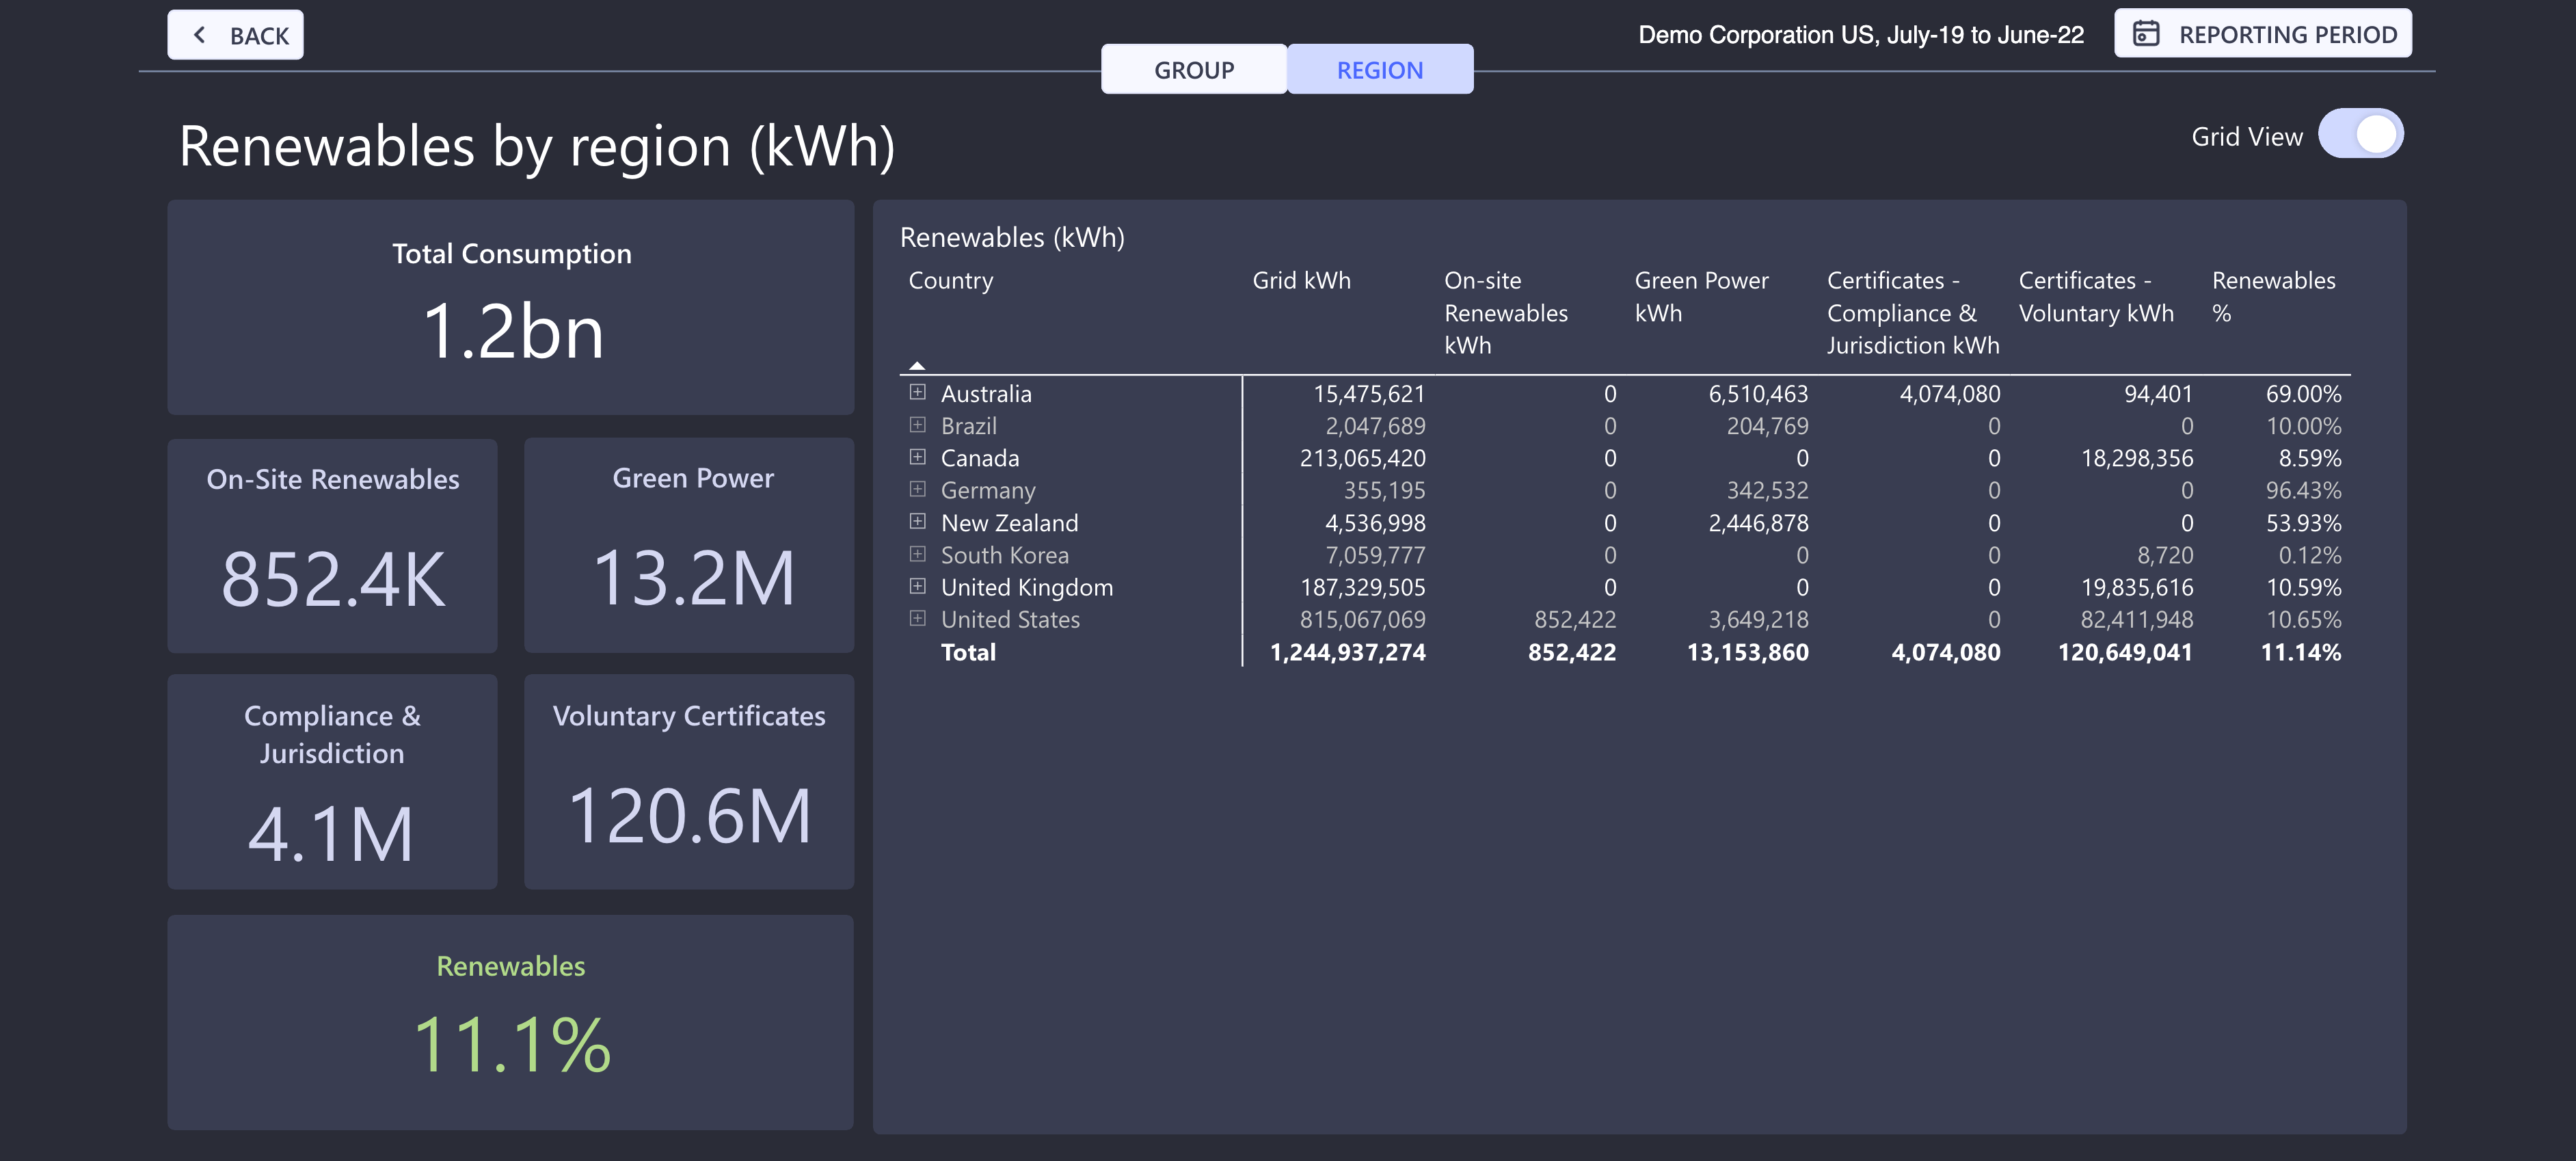
The grid is shown by clicking Grid View at the top right. This will provide a breakdown of all renewables by region or group, depending on the selection made at the top of the page.
Renewables percentage
The renewable percentage figure is derived by diving total grid consumption and on-site renewable electricity consumption by all renewables (also including on-site renewables electricity consumption).