
How to get data in Excel using Envizi API
Earlier versions of Excel with Microsoft Power Query installed, or later versions of Excel with Get & Transform installed by default are able to collect data through Envizi's web service API.
The steps and screenshots below are based on Microsoft Excel version 2013 with Power Query installed. The flow of steps should be similar to other versions of Excel.
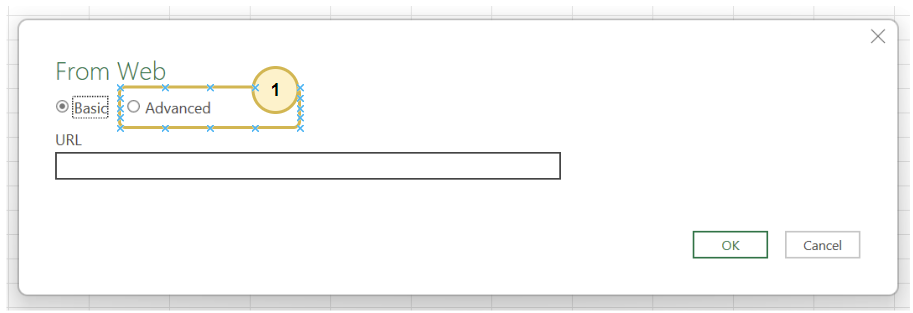
Open the Excel application, go to the menu then choose Data > From Web , then choose Advanced. Click Ok.
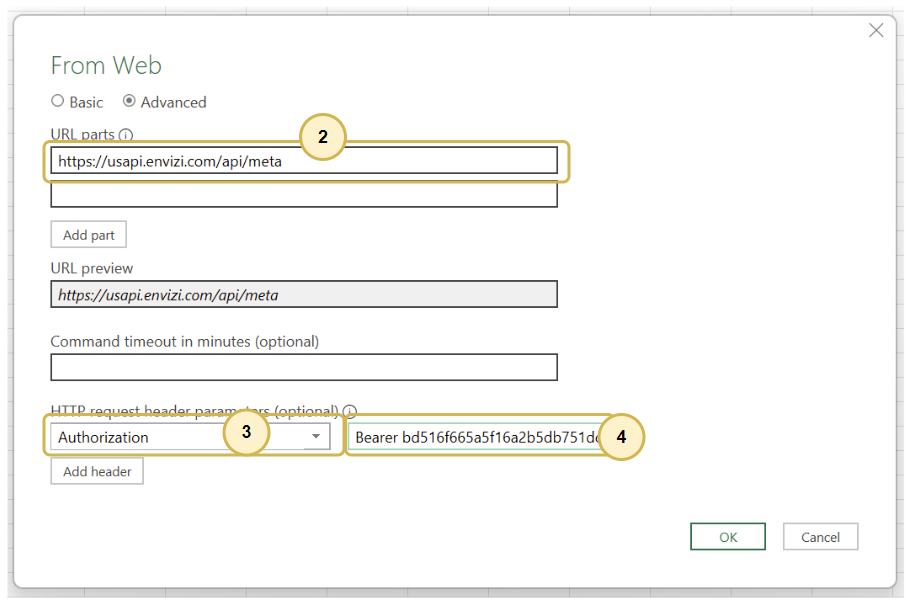
Supply your API access token for authentication.
Enter the Envizi API URL path of the report (for details on how to construct an API URL, check out the API Technical Documentation)
Enter the word
Authorizationon HTTP request parameters field, then on the next field enter the wordBearerfollowed by the access tokenSelect OK button to continue
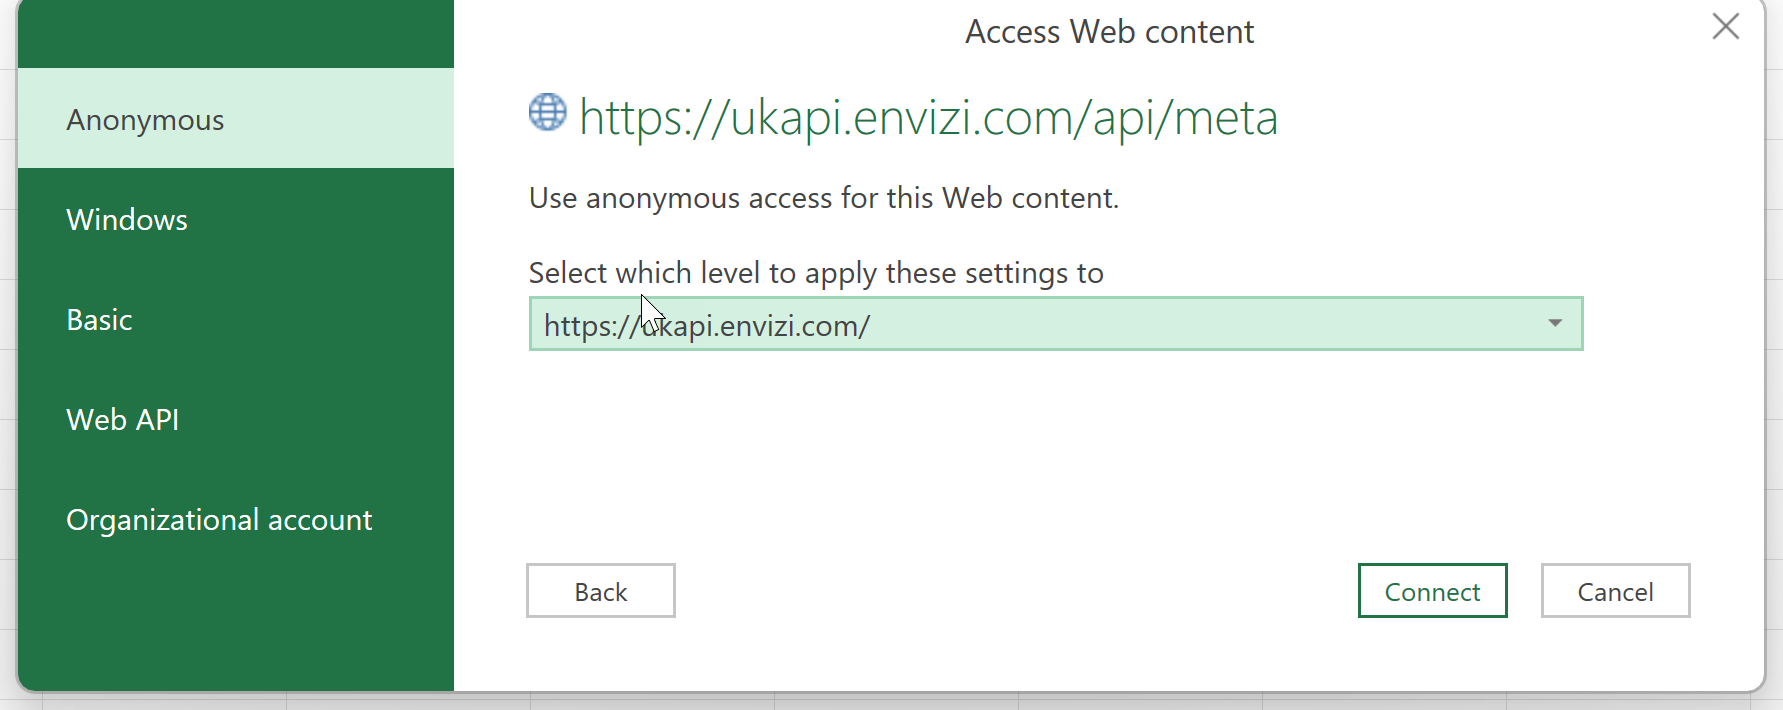
On the ‘Anonymous’ tab, click Connect to continue
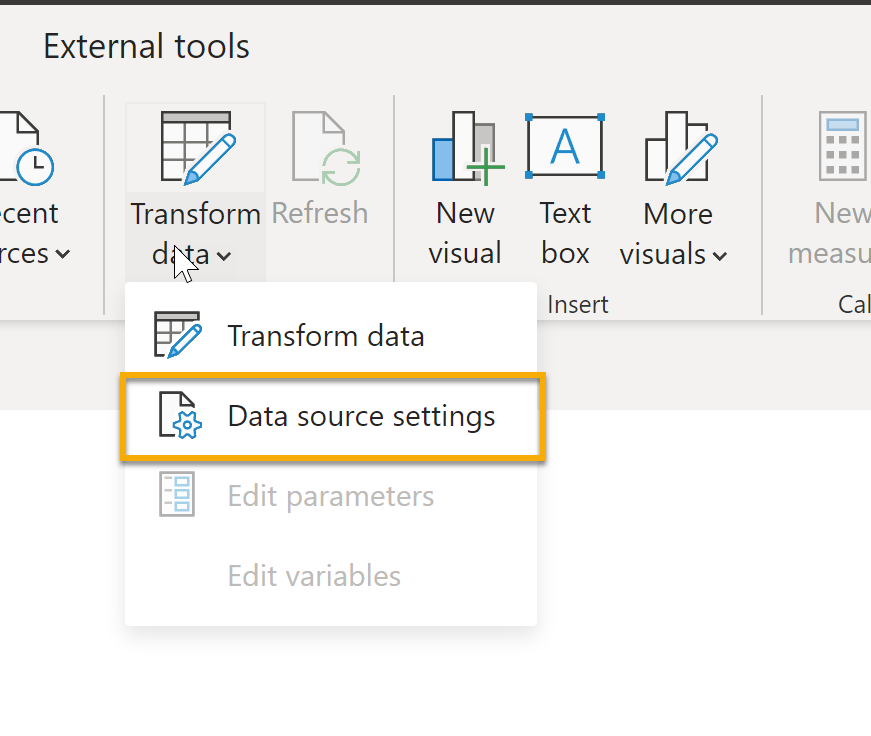
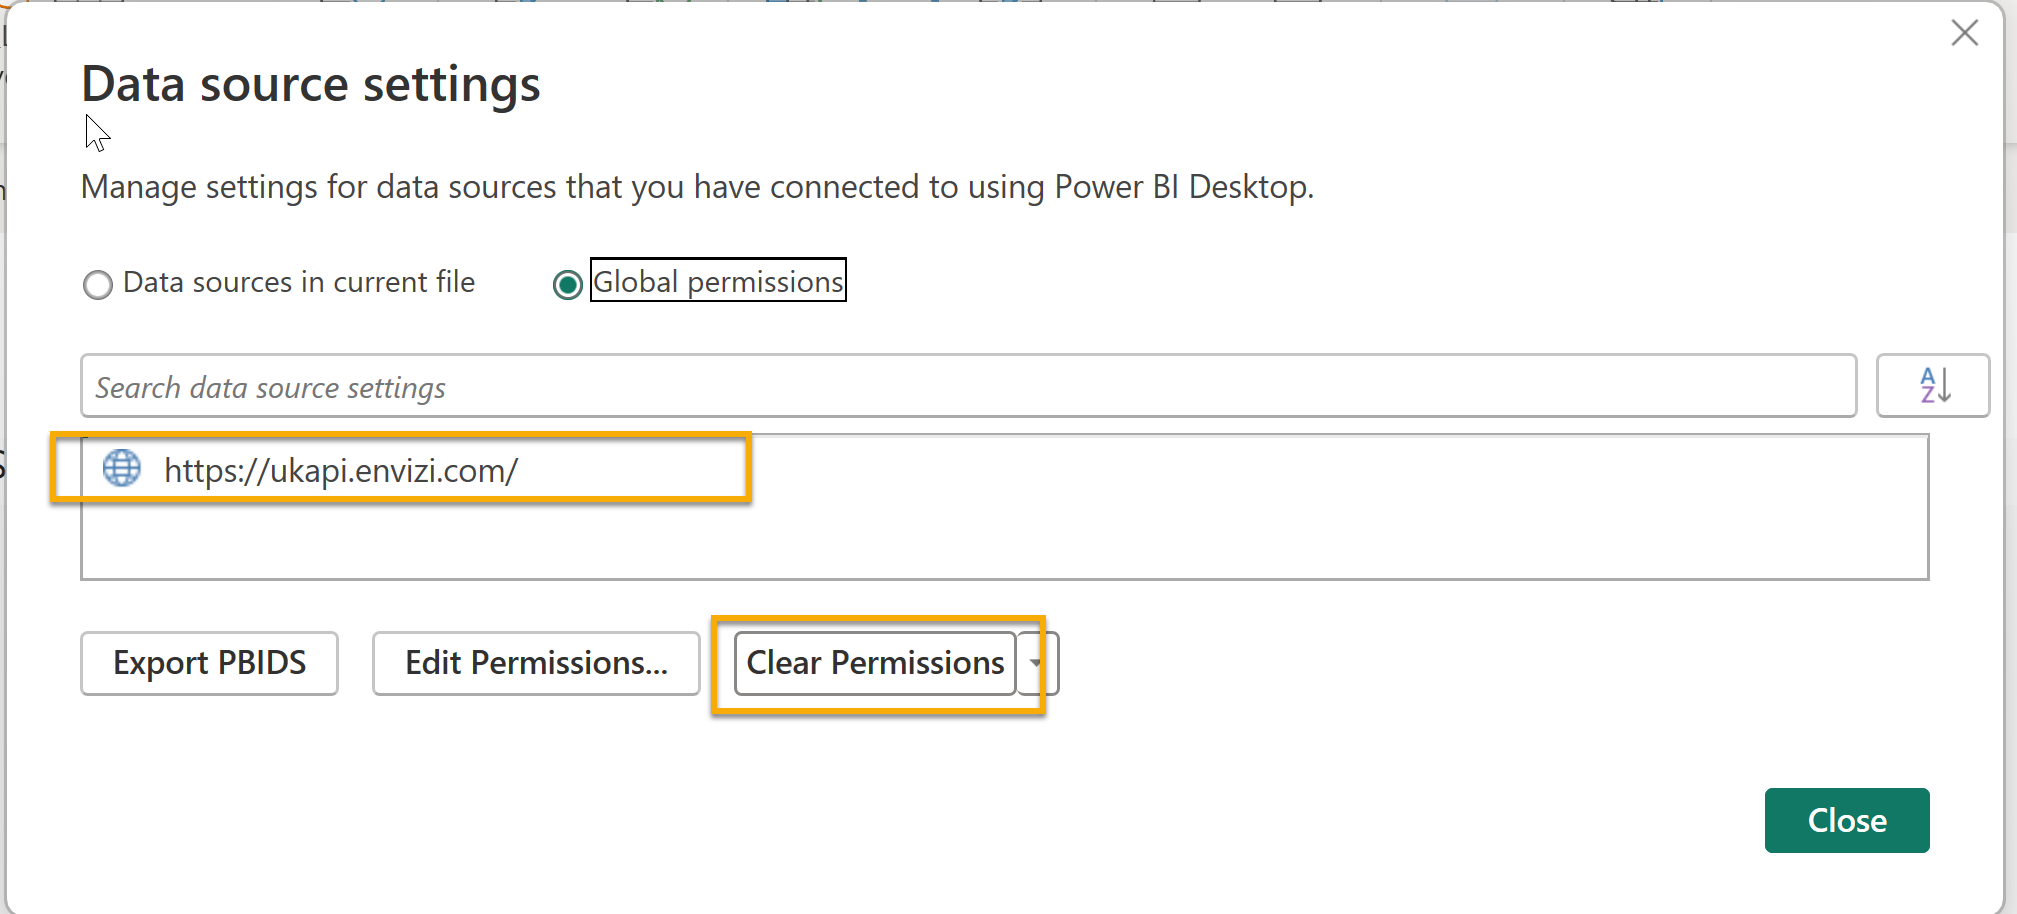
If you do not see the ‘Access Web content’ screen, it is most likely that you may have accessed the Envizi API URl using a basic authentication method before (user name + password). You would need to remove the credential that had been saved previously in your Excel environment, before you can switch to use API tokens for authentication.
To do this, go to Get Data → Data Source settings → Global permissions, choose the Envizi API url you would like to use tokens to access, and then 'Clear Permissions'.
Once this is done, repeat the the above mentioned steps to connect using an API token.
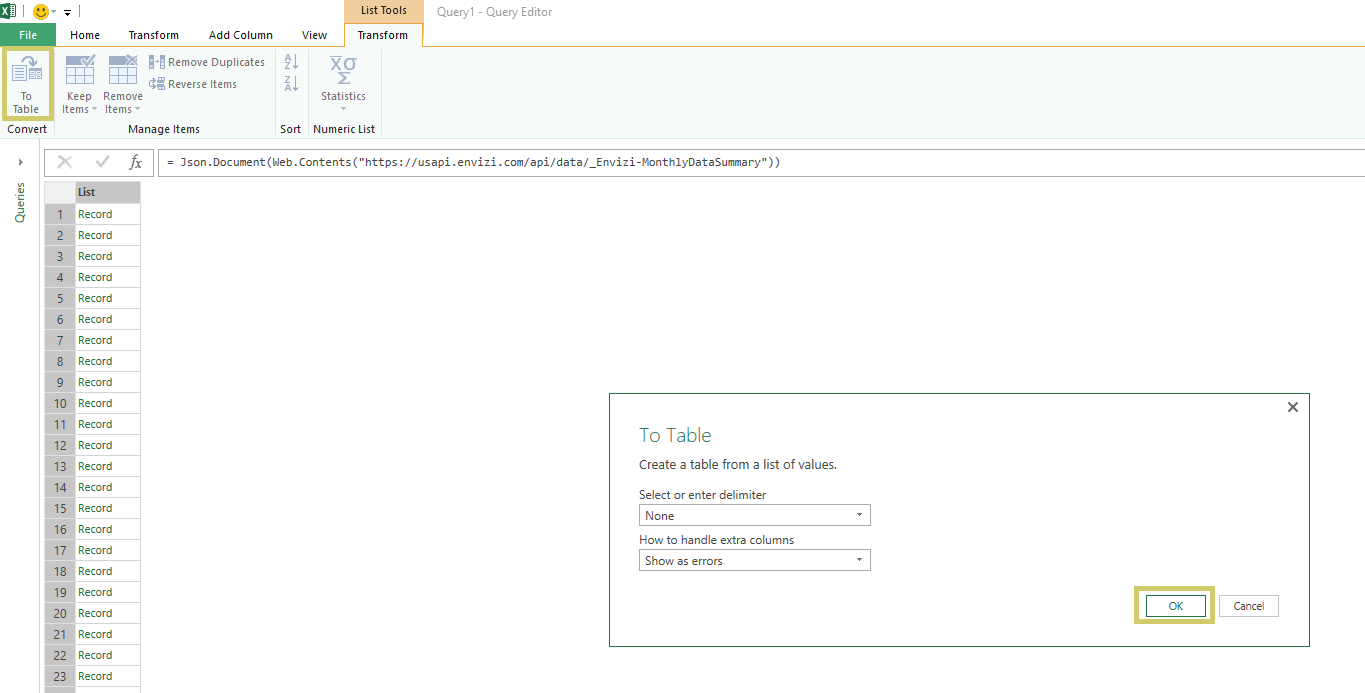
The Query Editor should pop up. Once everything is loaded, click To Table under the Transform tab. Click Ok in the pop up form.
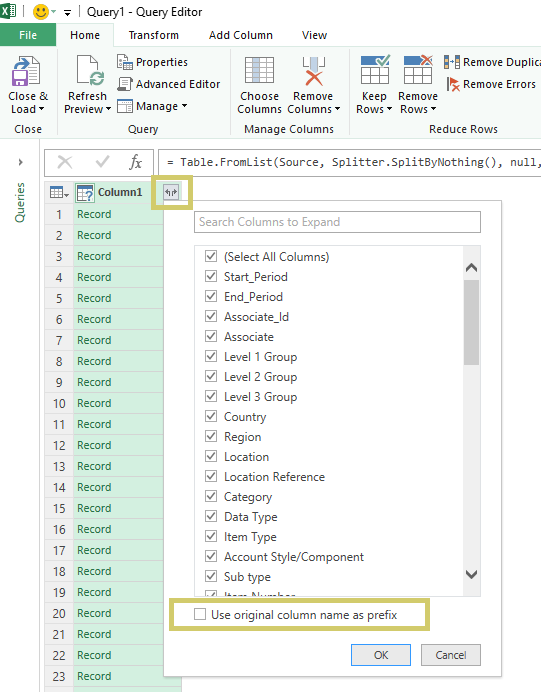
All of your data should be organized into a single column. Click the two-way expansion arrow beside the column header, in the pop up form un-select the last option 'Use original column name as prefix', and then click Ok.
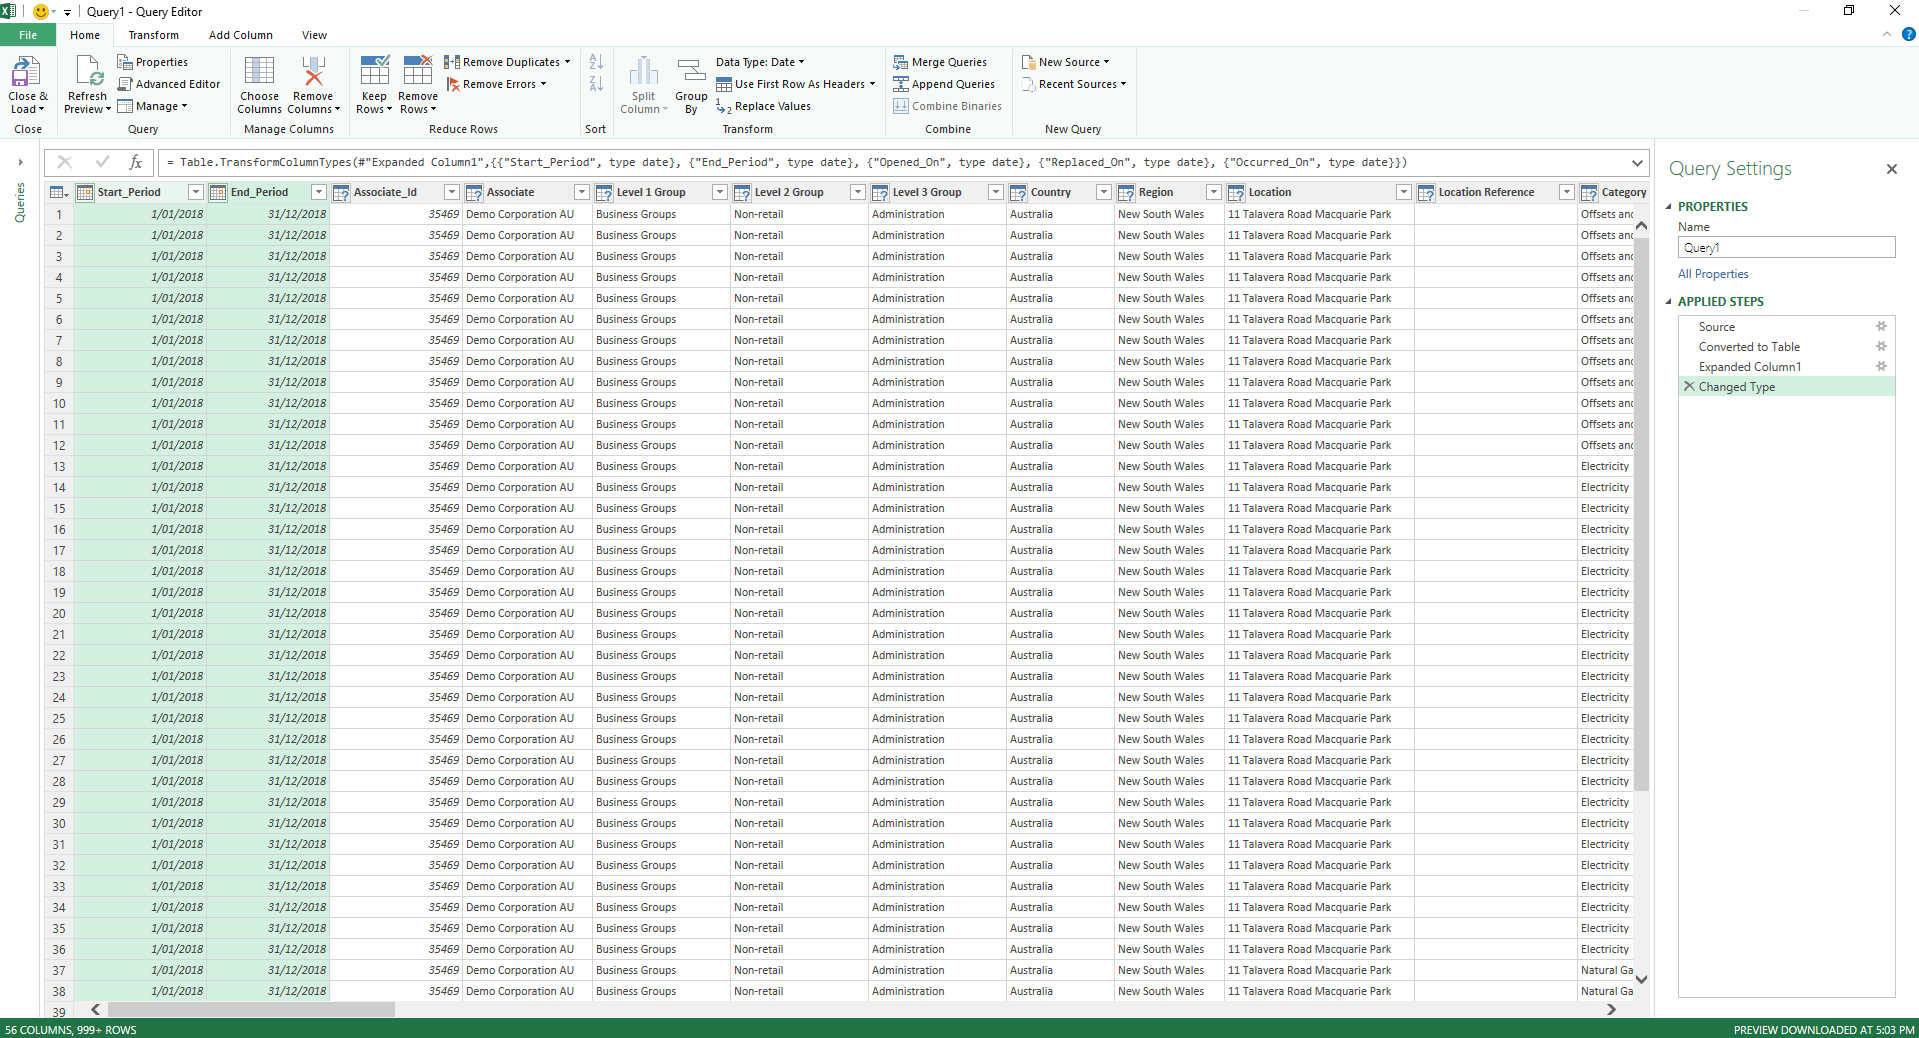
The data will now be presented as a table format in Query Editor. You may now continue with normal Power Query transform operations such as rename columns, re-arrange column orders, changing column data types etc. Since all data returned from API is in string format by default, so for a minimum it is recommended to:
Change the data type of all date related columns to be Date, and
Change the data type of all numeric columns to be numeric data type (Decimal Number, Whole Number etc.)
This will facilitate the analysis and reporting in the data model.
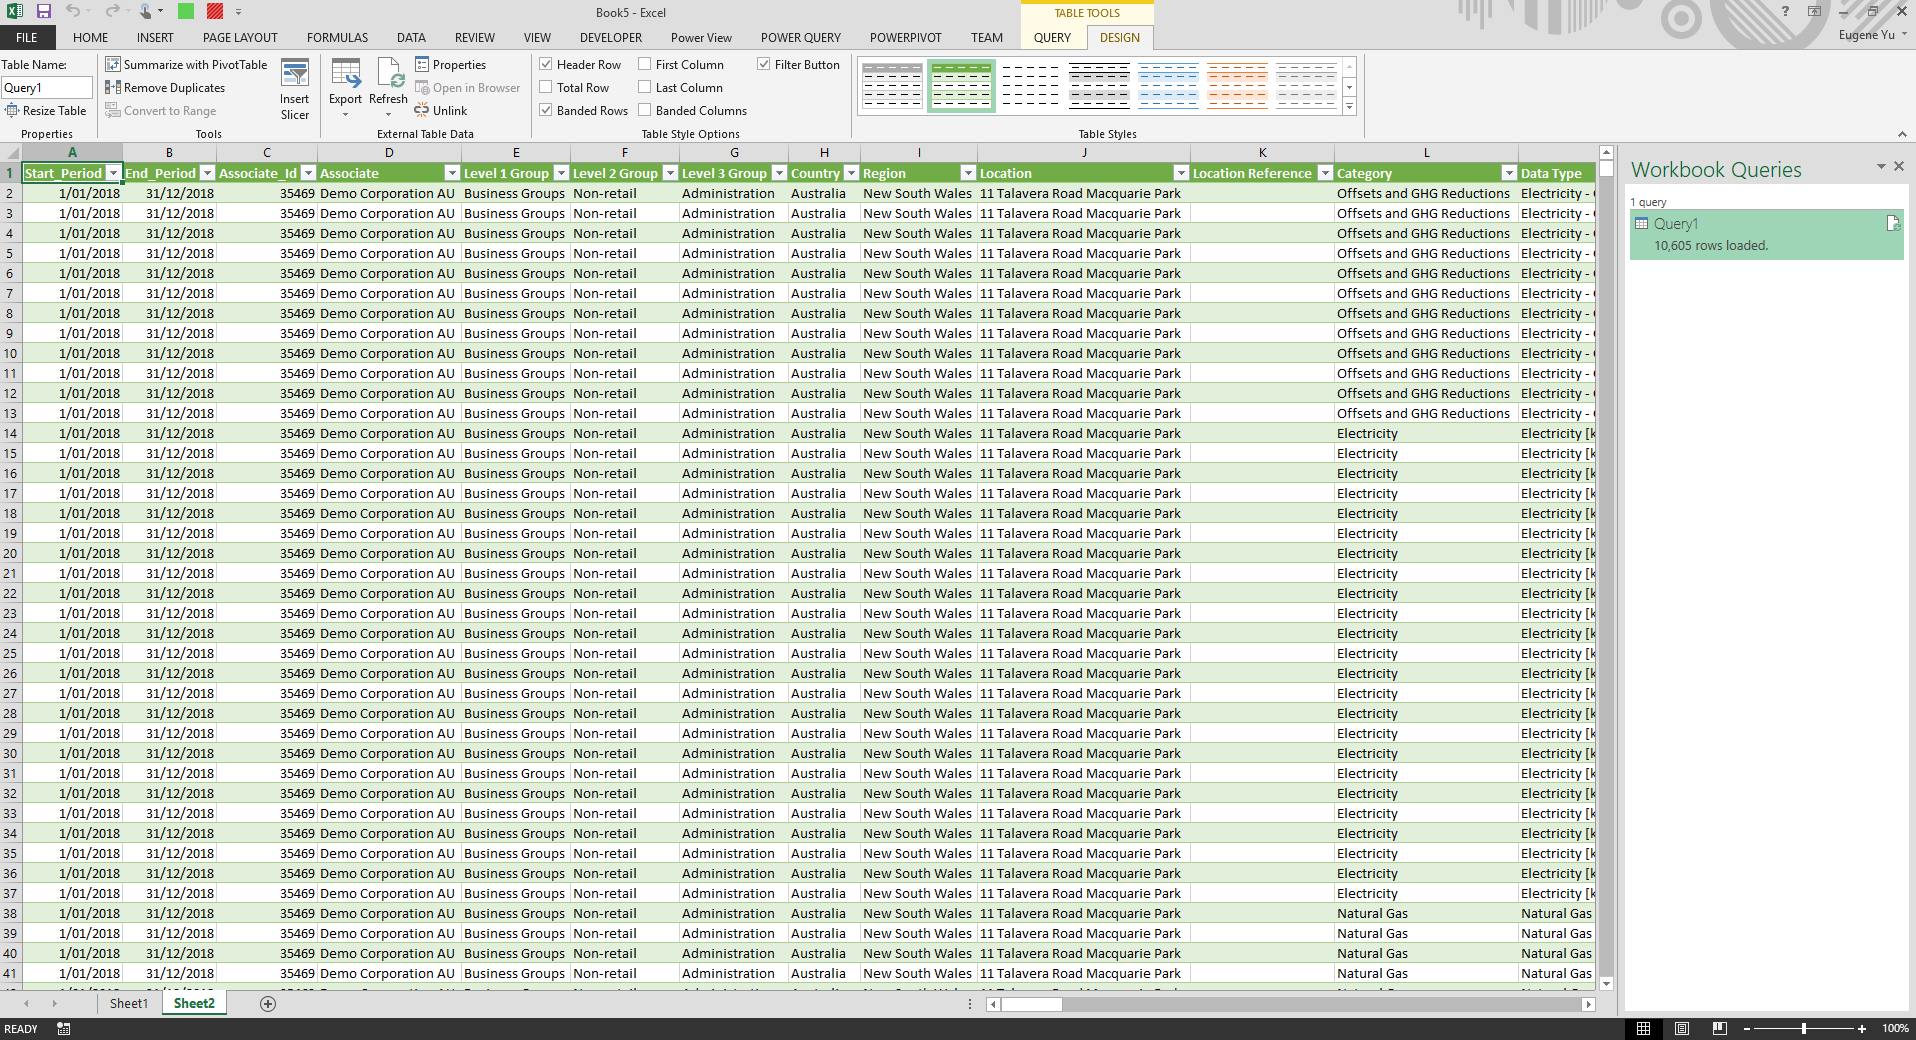
Click Close & Load to save the query and populate all data in a spreadsheet table. Depending on the amount of data to be retrieved, this may take some time as Excel needs to download all requested data from Envizi.
You can also choose to load the data into a Power Pivot model, and use multiple API queries to build your own Power Pivot model, just as you would do for any Power BI project.
Further Readings
Power Query (Get & Transform in newer versions) together with Power Pivot are powerful add-on in Excel which allow you perform advanced data analysis and create sophisticated data models, in addition to the incumbent Excel pivot tables. With Power Pivot, you can mash up large volumes of data from various Envizi API reports, perform information analysis rapidly, and share insights easily.
Read the official Microsoft documentation on Power Pivot for more advanced reporting options using Excel and the Envizi API.