EFD Meter Summary and Preview Panel
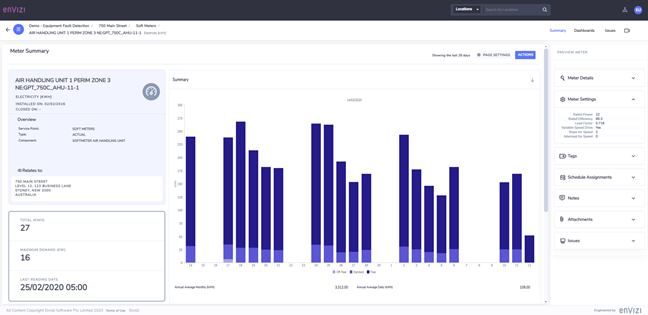
The Meter Summary dashboard provides a summary of the energy consumed by the selected Soft Meter. It displays Daily Energy Consumption for the the past 4 weeks in Bar chart format, Daily Energy Consumption and Maximum Demand in a data grid and also offers information about when the last data was captured.
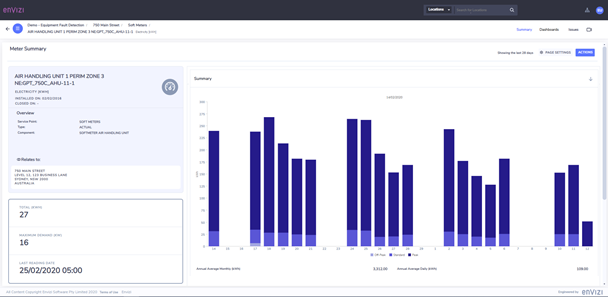
The right hand side Preview Panel displays information relating to the selected Soft Meter. Equipment Fault Detection specific areas are the Meter Settings displaying the Rated Power, Rated Efficiency and Load Factor. Also of interest important to EFD are Schedule Assignments which display Operating Schedules and Occupancy Schedules linked to the specific Soft Meter.