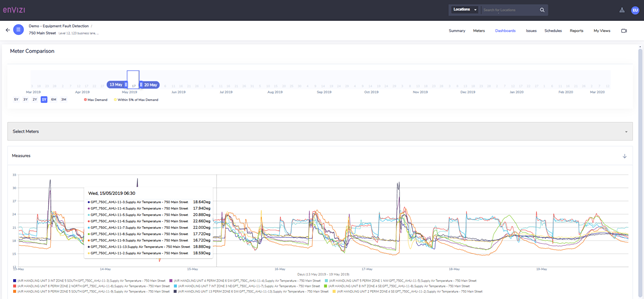
EFD Interval Chart Builder
The Meter Level Interval Chart Builder dashboard, available in the Dashboards tab, allows users to select and overlay a variety of data points (known as Measures) related to the selected Soft Meter. You can move the timeline control to the desired time period for which the measures are to be displayed and the Customize Chart dialogue box allows users ways to select Measures to be charted.
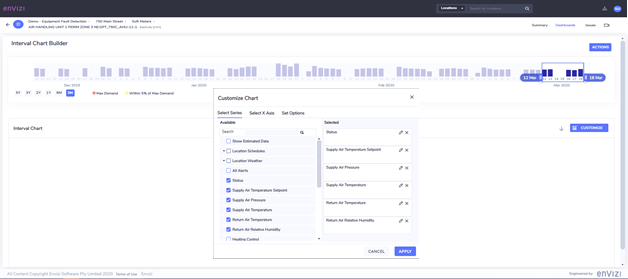
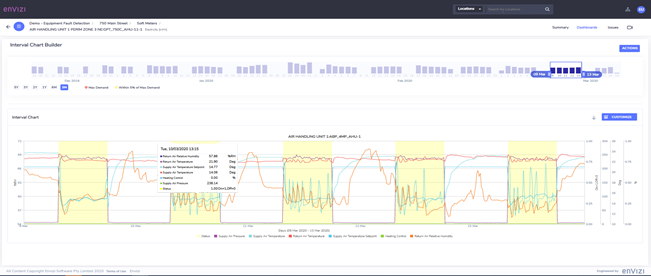
Once the desired measures are selected, the Generate Chart button displays the selected measures in the dashboard.
The Location Level Interval Chart Builder dashboard allows users to select and overlay a variety of data points (known as Measures) related to one or many Soft Meters over any time period. This dashboard can be found in the Dashboards tab at the Location level. The Customize Chart dialogue box allows users ways to select Measures to be charted. Global Measures such as Outdoor Air Temperature and Relative Humidity are always available for selection.
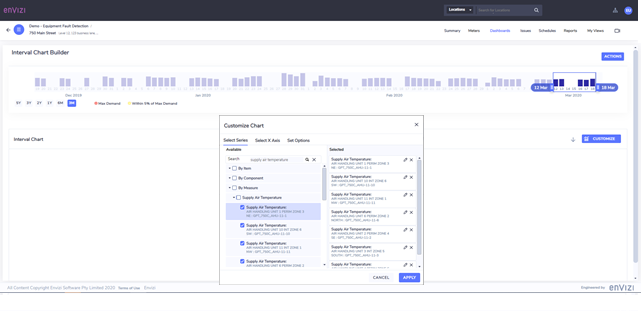
Once the desired measures are selected, pushing the Generate Chart button displays the selected measures in the dashboard.