Bulk Regression Analysis - Meters
Summary
The 'Bulk Regression Modeller - Meters' report allows you to perform bulk regression analysis on weather metrics for selected range of Meters, based on a few pre-defined parameters. The regression analysis in the report works the same way as the incumbent Regression Analysis dashboard on Meter, with the added advantage of running for bulk.
The report can be run in two modes - "View Only" mode or "Commit To Save" mode. In 'Commit To Save' mode, regression results for eligible Meters will be saved into the platform together with relevant HDD and CDD metric changes required for weather normalization reporting. The report can only be run as an email attachment in CSV format in both modes.
Report Prerequisite
To get most out of the report, it is recommended that for each Location included in the reporting selection criteria, the following should be configured prior to running the report:
Location should be linked to a valid weather station with up-to-date weather data ,or sufficient data for the historical period the regression analysis is to be run on
Base HDD and Base CDD temperatures (in Celsius) of the Location - under Location Settings, optional
Non-working days - under Location Settings, optional but recommended if there is any
Report Selection
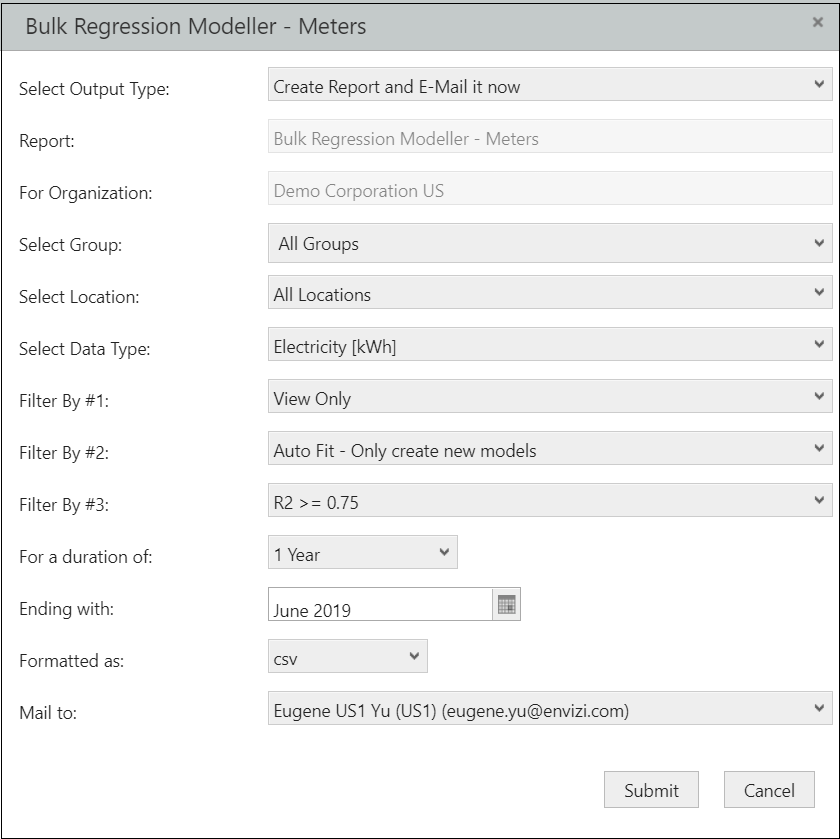
Similar to any other report in the platform, you can make a range of selections prior to running the report.

Selection | Description |
|---|---|
Group | Choose to run for one or all Groups. |
Location | Choose to run for one or all Locations. |
Data Type | Select a Data Type to run regression analysis on. You have to choose one particular Data Type, e.g. , Electricity [kWh]. Only Meters belong to the selected Data Type will be included in the report. |
Filter By # 1 - Execution Mode | Choose 'View Only' or 'Commit To Save' mode for the report. Default is 'View Only'. |
Filter By #2 - Coverage | You have the choice of letting the report to determine the best fit Base HDD and Base CDD temperatures for your Locations, or to pre-supply the base values by yourselves prior to running the report. At the same time, you can also choose to run the regression analysis for Meters that have not had a regression model set up before, or to run it for all Meters regardless of whether they have any existing regression models:
|
Filter By #3 - R2 Acceptance Criteria | When running the report in 'Commit To Save' mode, if an Meter's R2 regression result value is higher than or equal to the selected accepted R2 value, the model will be saved into the platform. When running the report under 'View Only' mode, these Meters will be marked as 'To Be Applied'. By default the accepted R2 value is 0.75:
|
Duration | 1 Month, 3 Months, 6 Months or 1 Year (default) |
Ending With | Choose a calendar month |
Duration of data for Regression Analysis
Although the report allows you to choose 1 Month or 3 Months to perform regression analysis, it is generally recommended to use at least 6 months of interval meter data (1 year is preferred) to perform the regression analysis in order to obtain a meaningful and strong correlation model.
Report Output
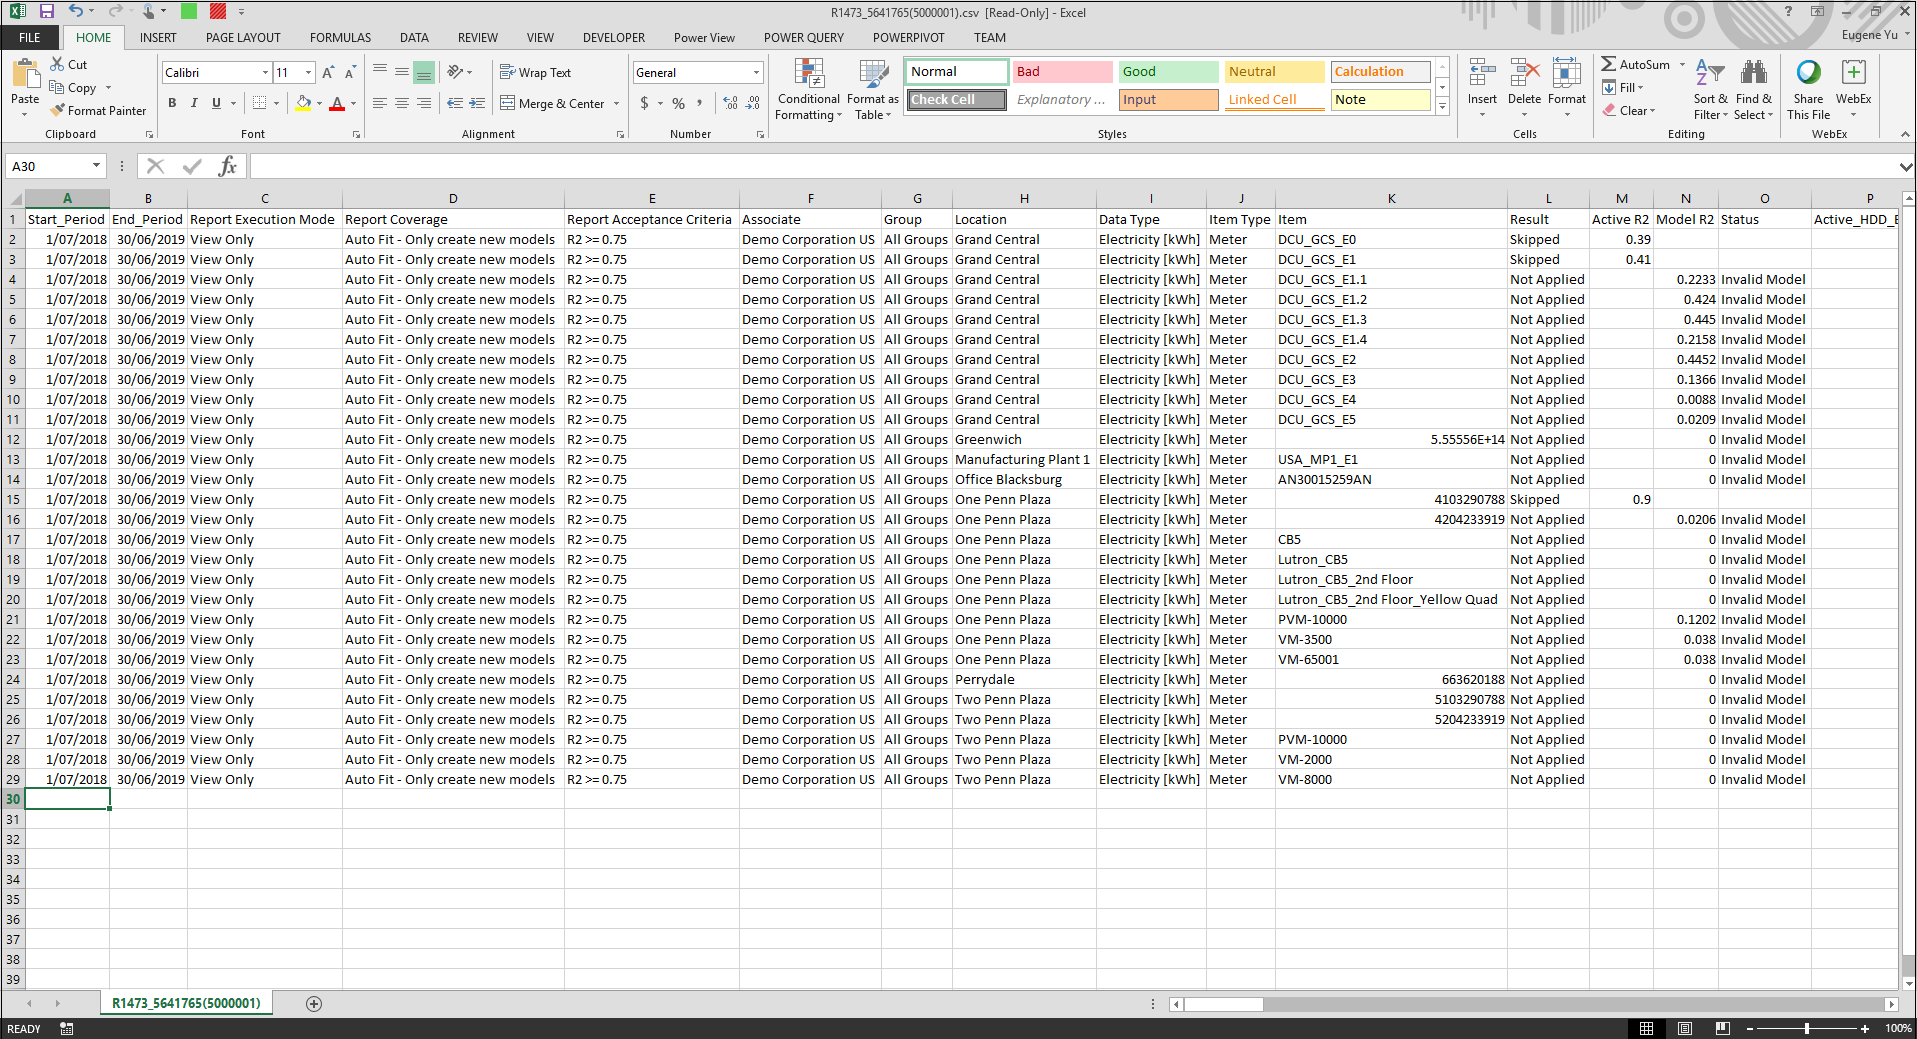
The report performs regression analysis on weather data for all active Meters included in the report selection range. The regression analysis result, together with the reporting outcome will be shown in the CSV report that comes with the email. Below are the explanations of some of the key columns in the report:
Column | Description |
|---|---|
Result | The outcome of running the report:
When running the report in 'Commit To Save' mode, the 'To Be Applied' items will be marked as 'Applied' instead. |
Active R2, Active_HDD_Base, Active_CDD_Base | The existing regression R2 result, Base HDD and Base CDD values associated with the Meter if any. The R2 value is a setting of the Meter while Base HDD and Base CDD values are settings of its parent Location. |
Model R2, Model_HDD_Base, Model_CDD_Base | The new proposed regression R2 result, best fit Base HDD and Base CDD values associated with the Meter after going through the regression analysis. |
Status | The result of the regression analysis.
|
Conflicting Location HDD_CDD Base Values | A warning message will appear here if Meters in the same Location have different best fit Base HDD and Base CDD values to each other, or any of them is different from its Location's existing Base HDD and Base CDD values. If the report is run in 'Commit To Save' mode, the Model_HDD_Base and Model_CDD_Base values associated with the Meter that has the highest R2 result among all Meters in the same Location will be saved into the Location settings, and it will be used for normalization reporting for all Meters in the same Location. |
Sample_Of_Data | Number of months in which consumption data is present and is used for the regression analysis. |
Message | Some additional information about the regression result, such as number of non-working days, unit of temperature, linked weather station etc. A preliminary assessment of HDD and CDD t-statistic result will also be shown here if applicable. This is also the same message you would get if running the same regression analysis using the dashboard. |

Closed Meters
The report excludes any meters that have been closed at the time of the report ending period. For example, if the report is run for 1 year ending Dec-2018, then any meters that have been closed in December 2018 or prior, will be excluded and not show up in the report.
Commit To Save
When running the report in 'Commit To Save' mode, the regression result together with relevant HDD and CDD metric changes will be saved into the platform - for Meters that are being marked as 'To Be Applied' if running the same in 'View Only' mode. Below is a list of things that will be saved or altered in the platform:
Entity | Attributes |
|---|---|
Meter Settings | Slope for HDD*, Slope for CDD*, Base Load for Working Day, Base Load for Holiday, R2, Regression Results, Regression Base Period |
Location Settings | HDD Base Temperature, CDD Base Temperature |
HDD and CDD Stats | HDD and CDD stats for the Location will be recompiled if there is any Meter in the Location has its Result equals to 'Applied'. This is a necessity because the calculation of HDD and CDD values relies on the Base HDD and Base CDD values, which could have been changed as part of this exercise. |
*The slope or co-efficient values of HDD and CDD will be saved in the form of Celsius - assuming the normalization reporting would use HDD and CDD values in Celsius. Therefore the value saved may be different from the value appearing in the report if it is in Fahrenheit. To get the corresponding Fahrenheit co-efficient, divide the Celsius value by 1.8.
Who can run the report?
The report can be run by both System Administrators and General Users of the platform in 'Commit To Save' mode.
Report Limitation
Like any other regression analysis tool, it is time consuming and computational intensive to perform regression analysis in auto fit mode - the tool is required to try out a large number of combinations of Base HDD and Base CDD values, before it can find a best fit. Generally it is expected that the report will time out if the number of Meters required for regression analysis exceeds 300.
It is recommended to run the report for a smaller set of data each time, e.g., for a Group only rather than running for the whole Organization. The performance will also be improved substantially if you can pre-determine and supply the Base HDD and Base CDD values for each Location, rather than using the auto fit method.
