
Bill Checking: Variance and Meter Comparison
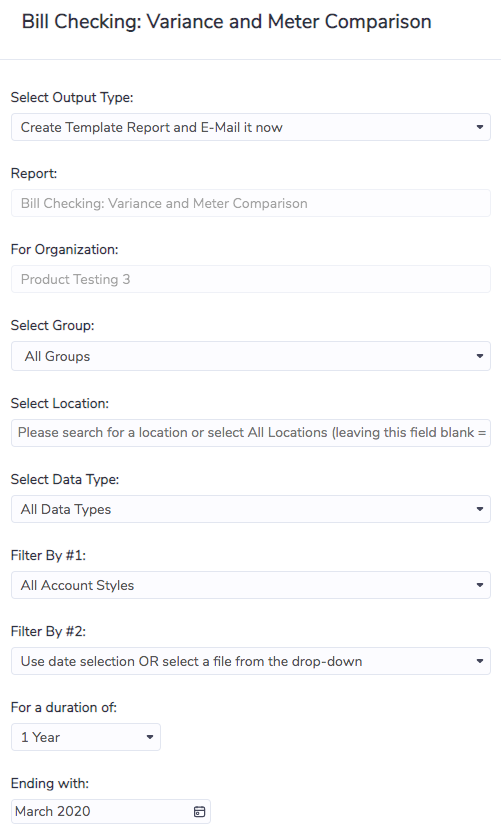
I want to analyze records for a reporting period
Select a time period as shown below. Note that a Data Type and Account Style can also be selected
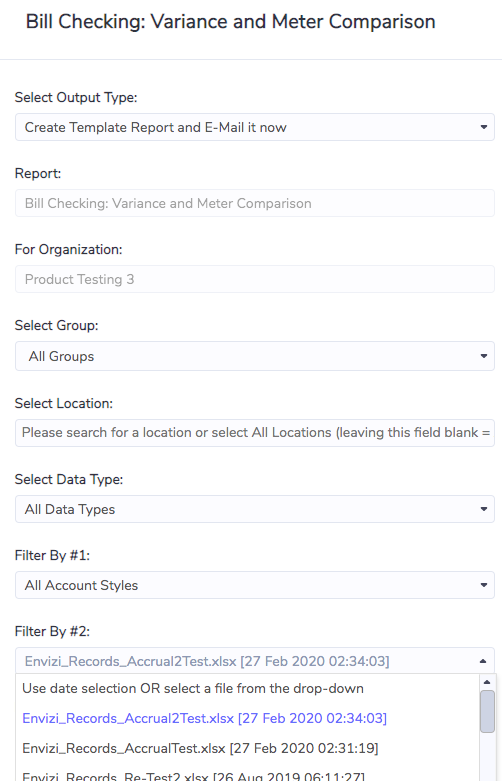
I want to analyze records for a data file that has been recently uploaded
Select a file from the drop-down as shown below. The drop-down includes the 20 most recently uploaded files (sorted chronologically). Note that if a data file is selected the time period selection at the bottom of the screen is ignored.
I want to analyze records with a significant (total) cost variance to the previous bill
Focus on the rows with the Cost column coloured in. Some points to consider in the analysis:
$ Variance to previous bill Threshold is used to highlight issues that exceed the threshold value. The variance calculation is adjusted for different billing periods to avoid the number of days impacting the results
There is no firm rule to the most appropriate value to use for the threshold. This will be learnt by the user over time and may vary based on the data type being analyzed, the amount of data in the report, the time available to run the analysis, and many other factors
The other data fields are included for reference purposes
This report will always return all records included in the report selection criteria. For example, if the data file selected contains 100 records then this report will have 100 rows in it. In contrast, the missing and overlapping report only includes exceptions. If no exceptions are found then that report will return no results
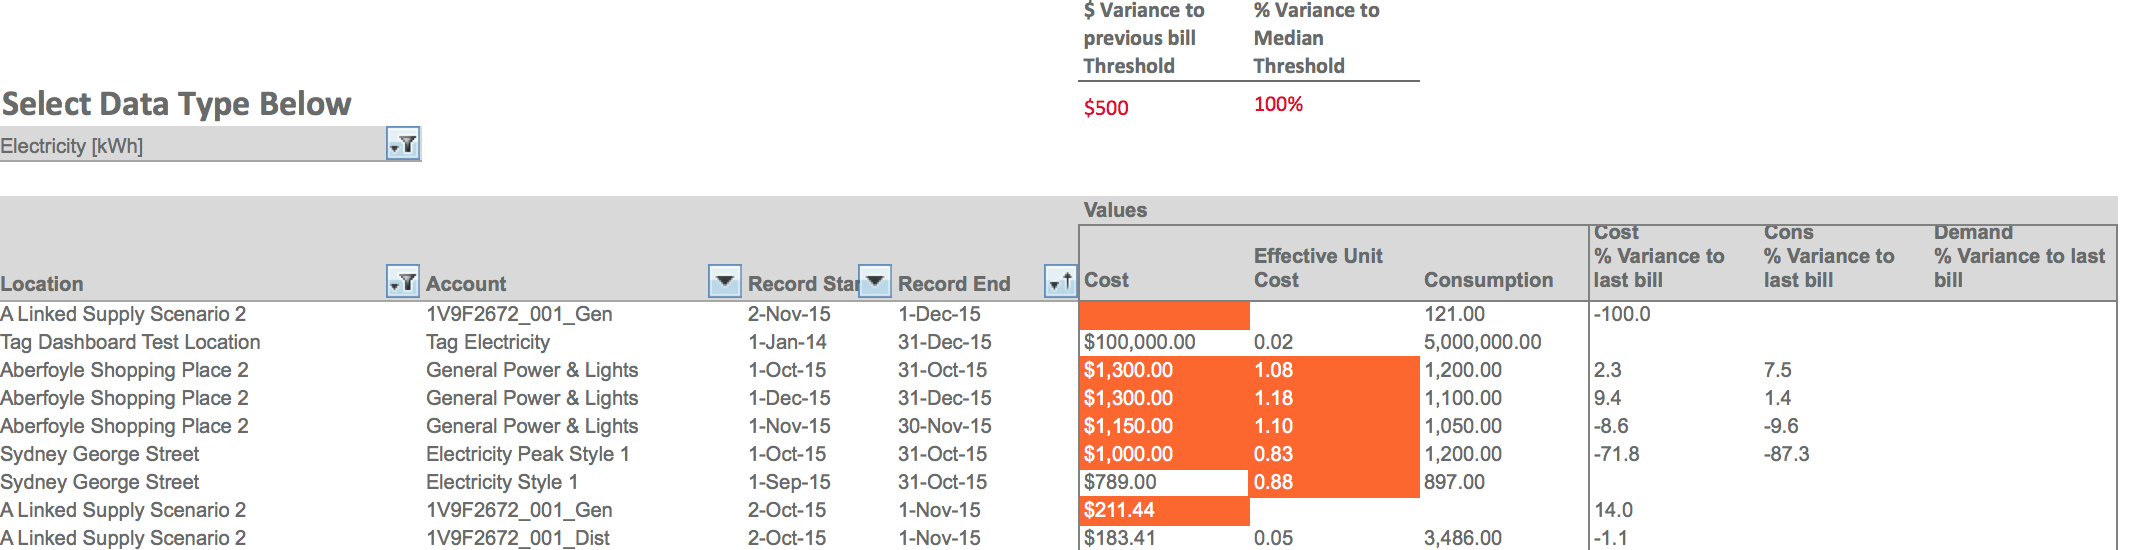
I want to analyze records with a significant cost per unit variance to other records
Focus on the rows with the Effective Unit Cost column coloured in. Some points to consider in the analysis:
% Variance to Median Threshold is used to highlight records with a significantly different effective unit cost to other records
Effective unit cost is calculated as total cost divided by total consumption. Instances, where one record varies significantly from others, should be investigated
There is no firm rule to the most appropriate value to use for the threshold. This will be learnt by the user over time and may vary based on the data type being analyzed, the amount of data in the report, the time available to run the analysis, and many other factors
The other data fields are included for reference purposes
Other notes
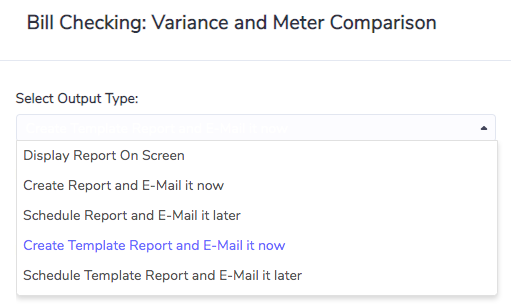
To access the excel version of the report as shown above the following run option must be selected. The report can also be scheduled to be sent out in excel format (bottom option in the drop-down)
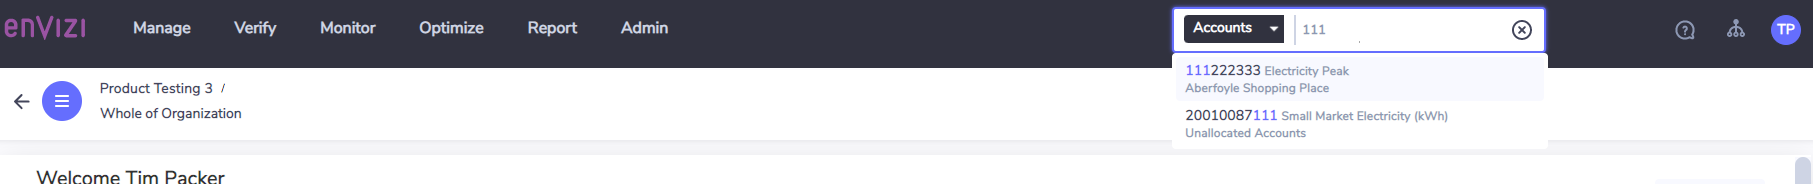
Exceptions are analyzed by navigating back into Envizi, searching for the account, and analyzing the records.
The report can be accessed in three ways:
Via the Verify menu at top of the screen
Via the Report menu at top of the screen
Using the global search menu for Reports
In the report, the DataSheet tab includes the underlying data shown in the main pivot table. This underlying data can be used for further analysis as needed.