
Bill Checking: Missing and Overlapping
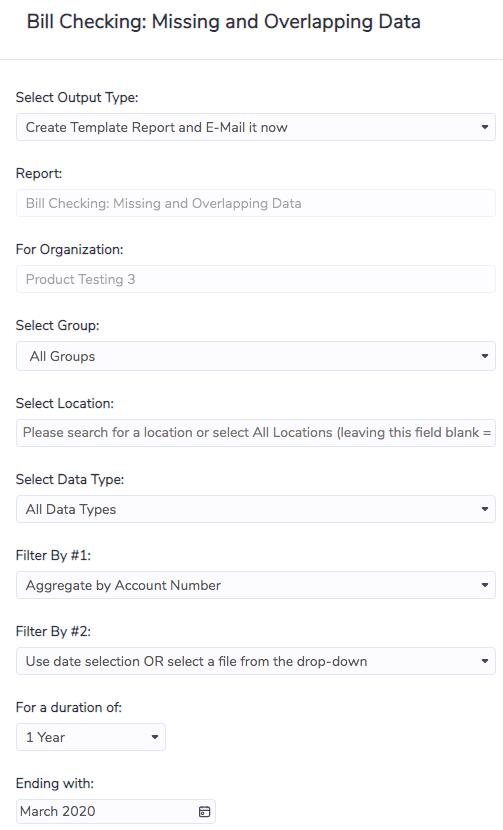
I want to analyze records for a reporting period
Select a time period as shown below. Note that a Group, Location and Data Type can also be selected
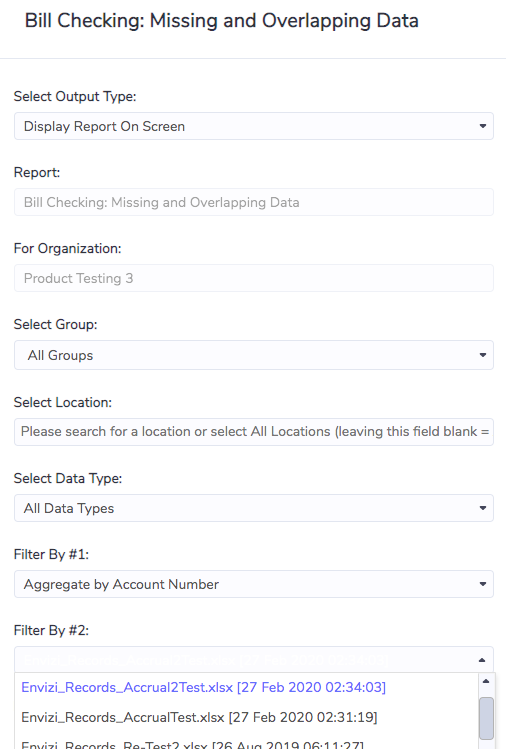
I want to analyze records for a data file that has been recently uploaded
Select a file from the drop-down as shown below. The drop-down includes the 20 most recently uploaded files (sorted chronologically). Note that if a data file is selected the time period selection at the bottom of the screen is ignored.
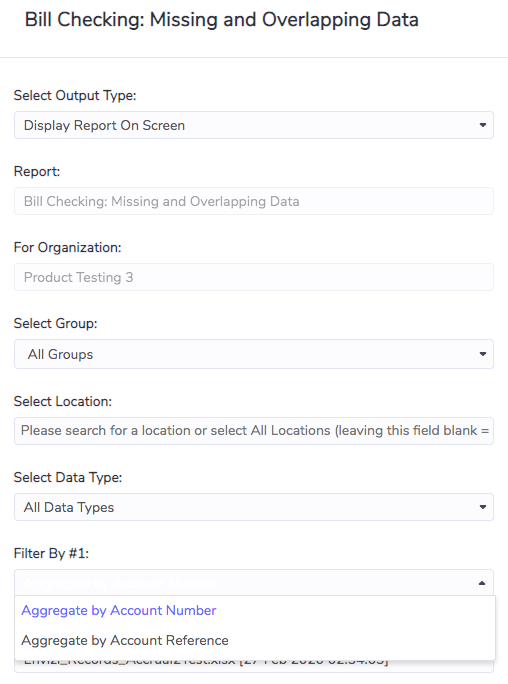
I want to analyze records based on Account Reference (rather than Account Number)
By default the report will aggregate and analyze data by Account Number. However, the analysis can also be run based on Account Reference. This is particularly useful when the Account Reference reflects the meter number and the Account Number has changed over time. Consider a retailer change impacting 200 electricity accounts. The user wants to check that bills do not overlap or are missing between the old and the new retailer. If the Account Reference is the same for the old and new accounts then this selection runs a continual analysis across the two accounts and flags exceptions.
I want to analyze missing records
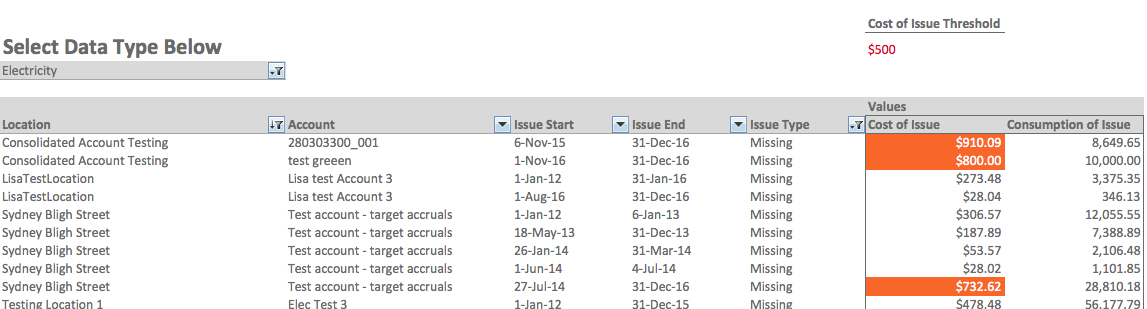
Filter Issue Type to be Missing to focus just on missing records. Some points to consider in the analysis:
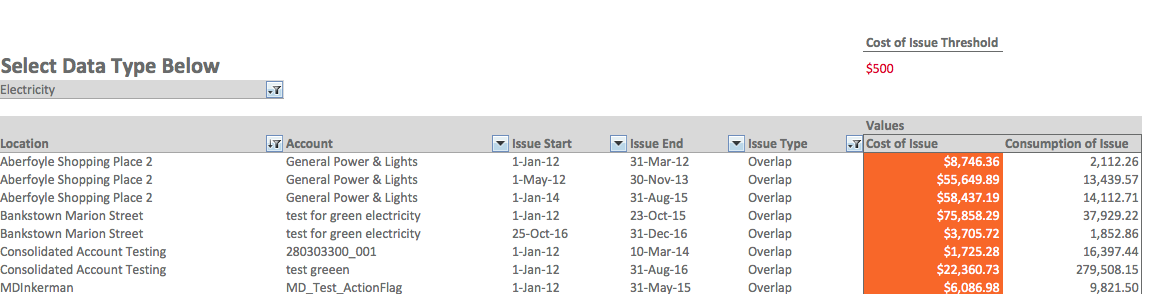
Cost of Issue Threshold is used to highlight issues that exceed an estimated cost amount. The cost amount is calculated based on the cost per day from the previous bill applied to the number of days identified as missing. There is no firm rule to the most appropriate value to use for the threshold. This will be learned by the user over time and may vary based on the data type being analyzed, the amount of data in the report, the time available to run the analysis, and many other factors
Consumption of Issue is included for reference purposes
If the report is run for a reporting then missing data exceptions will be flagged for that period only. Other missing data in the accounts will not appear in the report
If the report is run for a data file then missing data is checked for the periods immediately adjacent to the records in the report. Missing data for other time periods will not appear in the report. So for example a data file is selected that contains a record for 1-Mar-18 to 31-Mar-18. The report will check for a record to be present up till 28-Feb-18 and starting from 1-Apr-18. If this is found then no data is flagged as missing in the report
I want to analyze overlapping records
Filter Issue Type to be Overlap to focus just on overlapping records. Some points to consider in the analysis:
Cost of Issue Threshold is used to highlight issues that exceed an estimated cost amount. The cost amount is calculated based on the cost per day from the previous bill applied to the number of days identified as overlapping. There is no firm rule to the most appropriate value to use for the threshold. This will be learned by the user over time and may vary based on the data type being analyzed, the amount of data in the report, the time available to run the analysis, and many other factors
Consumption of Issue is included for reference purposes
If the report is run for a reporting then overlapping data exceptions will be flagged for that period only. Other overlapping data in the accounts will not appear in the report
If the report is run for a data file then overlapping data is checked for the periods immediately adjacent to the records in the report. Overlapping data for other time periods will not appear in the report. So for example a data file is selected that contains a record for 1-Mar-18 to 31-Mar-18. The month of March is analyzed for overlapping records. If nothing is found then no data is flagged as overlapping in the report (even if there is overlapping data in Feb-18)
Other notes
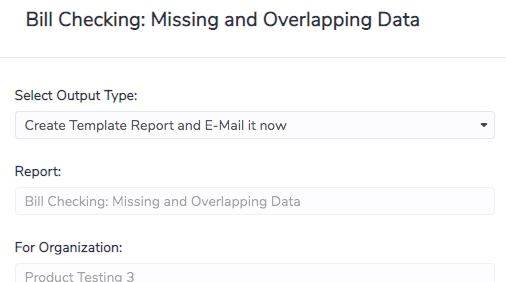
To access the excel version of the report as shown above the following run option must be selected. The report can also be scheduled to be sent out in excel format (bottom option in the drop-down)
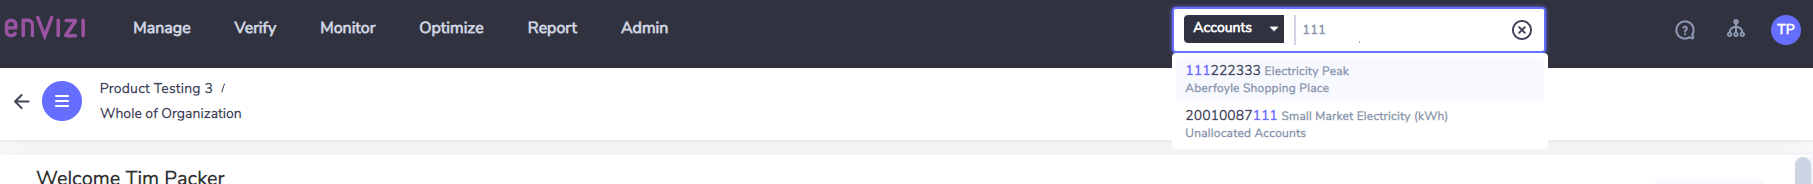
Exceptions are analyzed by navigating back into Envizi, searching for the account, and analyzing the records.
The report can be accessed in three ways:
Via the Verify menu at top of the screen
Via the Report menu at top of the screen
Using the global search menu for Reports
In the report, the DataSheet tab includes the underlying data shown in the main pivot table. This underlying data can be used for further analysis as needed.